
Spark on Azure: Big Data Made Easy
Apache Spark is an all-in-one Big Data solution which makes it easy to get great results from large datasets; it's gathering momentum - here's how Google trends reads it from the first Apache release till now:
It's available on Azure as a new type of HDInsight cluster, and although it's in preview at the moment running an old-ish version of Spark, there are good reasons to start looking at it:
- Spark supports real-time and batch data analysis - it has streaming support to integrate with event streams (like Azure Event Hubs) and it also has a SQL engine which can run SQL and Hive queries in batch over different data sources - like HBase or HDFS;
- Spark has advanced analytics capabilities - with libraries for machine learning and graphing over data sources;
- Spark supports different scheduling engines, including its own master-slave cluster mode; in HDInsight it runs without Zookeeper, so you need fewer machines in your cluster;
- Spark supports defining and running queries in notebooks so you can easily explore data and visualize results.
Spark consolidates a whole range of Big Data technologies, so with a single cluster you could replace multiple worker roles, web roles and other HDInsight clusters
In this post, I'll show you how to create a cluster and use Spark SQL to build a user-facing dashboard very easily.
Getting Started
You can create a Spark cluster form the Azure Portal, as a new HDInsight cluster, giving it a name and selecting the cluster type as Spark (PREVIEW) - you can run on Windows servers or Linux (sign-up to the preview is required for Linux but on Windows it's a public preview):
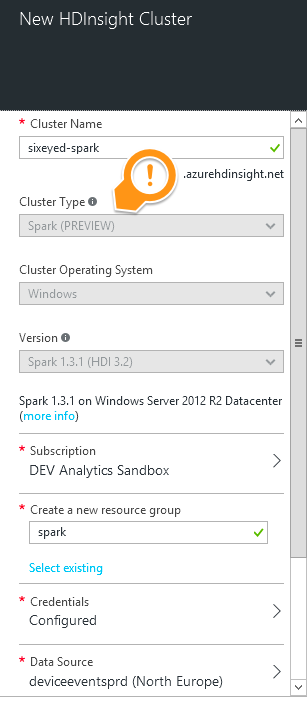
You need to provide credentials to log in to the Web interface on the cluster, and you need to specify the Azure Storage Account to use as the source of the data. This account will be where your existing data is that you want to query with Spark.
Scroll down and you can specify the size of the cluster - the number of worker nodes to run, and the size of the worker and head nodes:
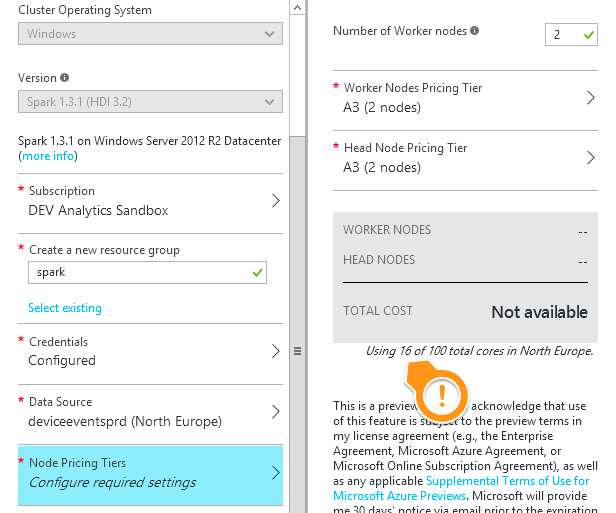
At the moment, the default cluster size is 4x A3 worker nodes and 2x A4 head nodes - but you can scale down to A3 machines throughout, so with 2 worker nodes you can run a cluster with just 16 cores.
As usual, it will take 10+ minutes for the cluster to spin up, then you'll have a fully configured Spark cluster ready to use
The Spark Dashboard
When the cluster is created, you'll be able to log in with the credentials you specified at https://your-cluster-name.azurehdinsight.net:
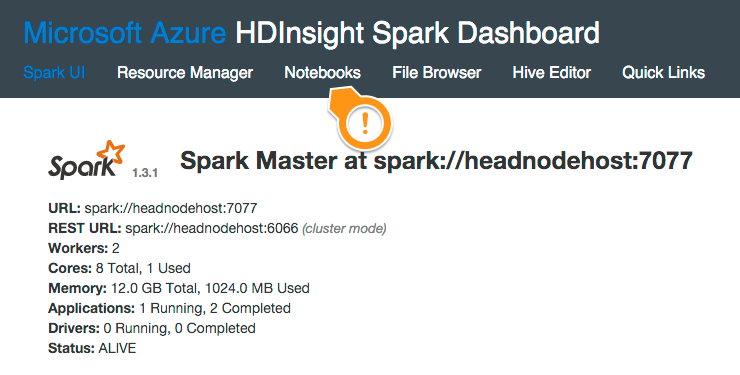
The top navigation has a bunch of options - the standard Spark Web UI and resource manager, and the simplest way to start using the cluster, with the Notebooks tab - create a new Zeppelin notebook:
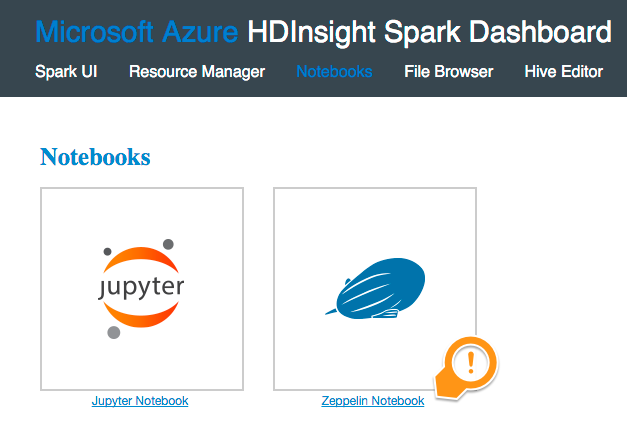
Zeppelin supports markdown and uses interpreters to support different languages (like Scala and Python). It can generate different visualizations and even provide input fields so you can build interactive notebooks, but let's start with some simple queries.
Source Data
In my storage account I have a container filled with files recording events sent from mobile devices. Files are in the typical HDFS format - GZipped JSON, where each line in the file contains a single event.
The folder structure for the files is striped by time period and the data partition like this:
<container>/year/month/day/event-hub-partion-id/period.json.gz
->
device-events/2015/12/14/p0/2015121411.json.gz
The files themselves contain events of different types from different sources, like this:
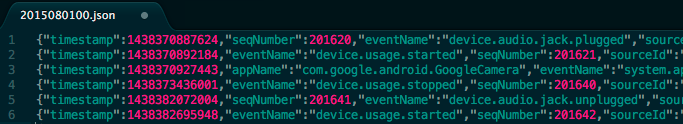
Certain fields are present in every event, like the timestamp, event name and source device ID - but for different events, the rest of the fields are all variable.
This is a good starting point for structuring the deep storage part of your Big Data solution - I cover it in more depth in Module 3 of my Pluralsight course Real World Big Data in Azure, 'Storing Event Data for Batch Queries'
The container is in the Storage Account which I used as the data source for my Spark cluster, but it's not in the root container that the cluster uses. I can access all the files in the Account, but I need to use a fully-qualified WASB address, like this:
wasb://device-events@my-storage-account.blob.core.windows.net/2015/12/14/11/p0/2015121411p0.json.gz
Querying HDFS Data with Spark SQL
In Zeppelin, notebooks are composed of multiple notes - each note can run several queries, split into paragraphs. In HDInsight there's a default note called Zeppelin HVAC tutorial which you can use with sample data that's created with the cluster. That's worth looking at, but you'll learn more from this post...
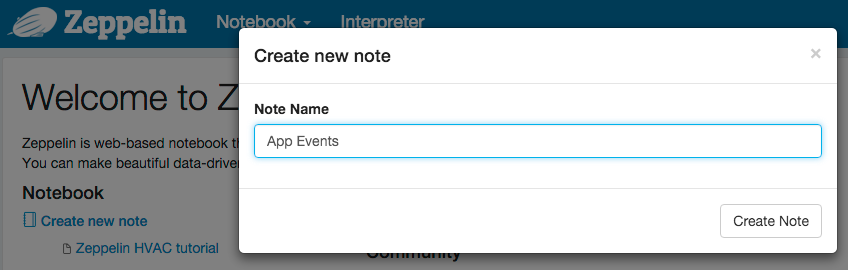
I'll create a new note and give it a name - this one will be for finding App events:
Every note in the Zeppelin notebook has some pre-defined variables set up, which you can use to work with Spark and the Zeppelin interface:
sc- the SparkContext for working directly with SparksqlContext- the SQLContext for working with data through the Spark SQL libraryz- the ZeppelinContext for interacting with the UI, and loading libraries into the Notebook
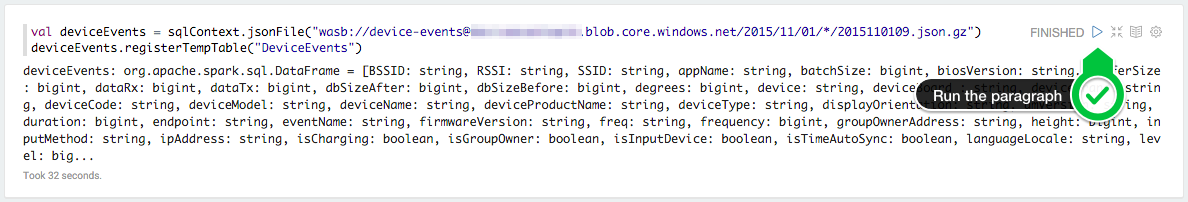
To run SQL queries over the event data in my HDFS files, I need to load them into the Spark Context and then register the data as a temporary table. This paragraph prepares a small subset of events to be queried - it's in Scala, which is the default language for Zeppelin notes, but it should be pretty clear:
val deviceEvents = sqlContext.jsonFile("wasb://device-events@s-a.blob.core.windows.net/2015/11/01/*/2015110109.json.gz")
deviceEvents.registerTempTable("DeviceEvents")
That's pretty simple stuff - it creates me a temporary table in the Notebook's Spark SQL context, called DeviceEvents, which is all the setup I need to query that data with SQL. The input pattern for the files uses a wildcard for the partition part of the structure, so this is loading me a full hour's worth of files from a single day, across all partitions.
Spark uses deferred execution, so normally setting up a pipeline to read data is cheap - it's only the actual query which returns results that gets split into jobs and distributed across the cluster, and can take a long time to run. But the jsonFile method infers the schema for the table, so it looks at all the data and it will take a while to run (alternatively you can specify your own schema, only mapping the fields you're interested in).
Run the paragraph with the play button, and the response will show you all the fields that Spark has inferred for the schema, using the names from the JSON and computing the data types:
Running Spark SQL Queries
Zeppelin supports different languages through plug-in interpreters. The current Azure implementation is limited to Scala and Spark SQL (the standard Zeppelin/Spark install also supports Python, Hive and more). You switch interpreters with a % directive at the start of a paragraph, so this statement will run a Spark SQL query to count all my events:
%sql
SELECT count(*) FROM DeviceEvents
Zeppelin neatly formats the response, in this case it's a large(ish) integer so it's displayed with a pretty number format:
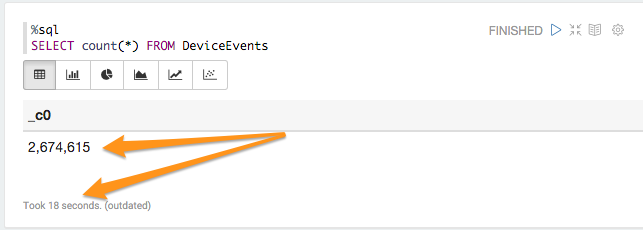
It took 18 seconds to count over 2.5M events distributed across 24 files in HDFS, running on a minimal Spark cluster (2xA3 data nodes, and 2xA3 master nodes). That's not really Big Data, but in our production system we store around 500M events per day, and we'd query those in exactly the same way - just using a different filter for the file names in the data source.
The version of Spark on HDInsight right now is 1.3.1, an older version where the Spark SQL library isn't so fully featured - but you can still run much higher values queries than this basic count.
One of our events captures when an app gets started on a device, so a useful query is to see the most popular apps during a period. In this case the period is limited to a single hour by the definition of the temporary table, but we could make the configurable and let the user choose.
The Spark SQL to get that count is simple stuff, just using standard SQL concepts like GROUP BY, ORDER BY and LIMIT. This gives me the top 10 most popular apps, and the number of devices using them, in descending order of popularity:
%sql
SELECT appName AS App, COUNT(sourceId) AS Usage
FROM DeviceEvents
WHERE eventName = 'app.started'
GROUP BY appName
ORDER BY Usage DESC
LIMIT 10
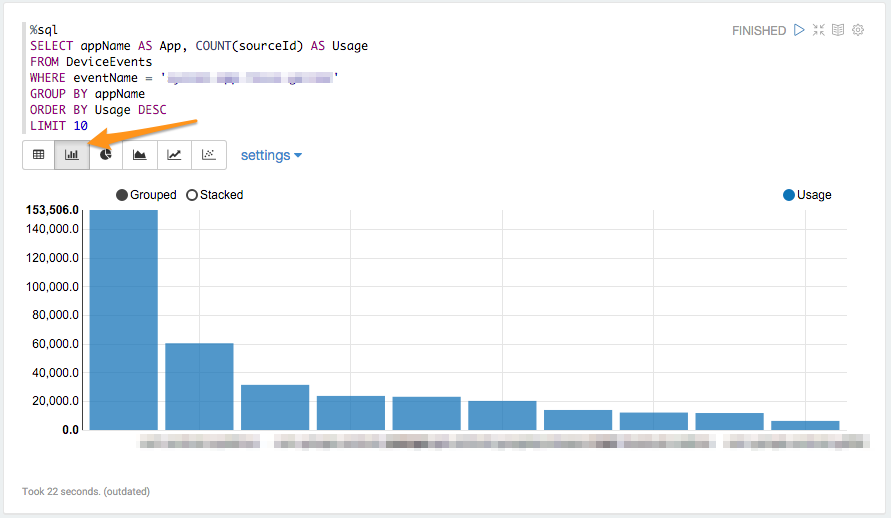
When I run that paragraph, the results are presented in a table (actual app names obscured) - but Zeppelin also gives me a nice toolbar with other visualization options:
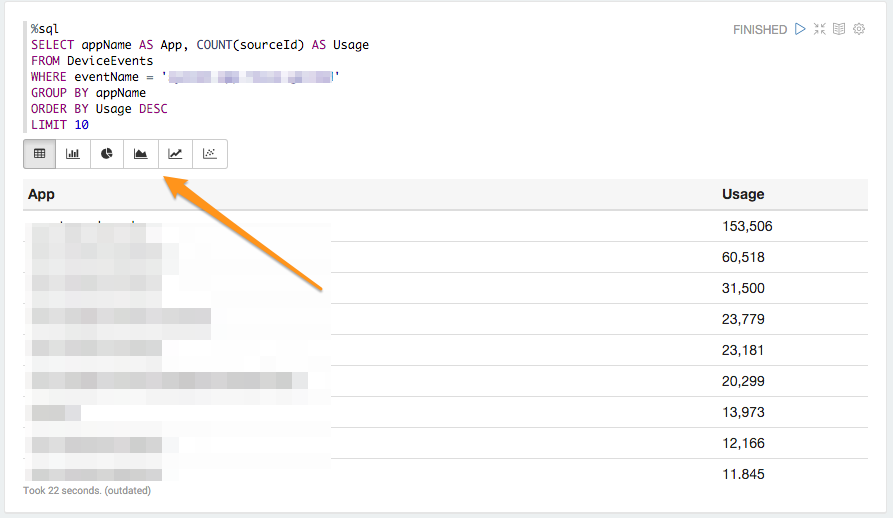
With a click I can switch the same results to a bar chart, pie chart, scatter graph etc. I don't need to run the query again, or configure the visualization at all - just click a button and see the same results in a more useful way:
Making Spark SQL Queries Interactive with Zeppelin
Paragraphs in Zeppelin are living fragments of code. We've seen how easily you can run static queries, but with not much more effort you can make that query interactive, so users can run it for their own parameters. This query groups all events by the event type, so we can see the most common - and it lets users select a prefix for the event types to display:
%sql
SELECT eventName AS Event, COUNT(sourceId) AS Occurences
FROM DeviceEvents
WHERE eventName LIKE '${Prefix=System,sys(System)|dev(Device)}%'
GROUP BY eventName
ORDER BY Occurences DESC
LIMIT 10
Mostly that's straightforward SQL, but the value for the LIKE in the WHERE clause is set up to be injected by Zeppelin. The dollar-braces format escapes user input from the query, and this template:
${Prefix=System,sys(System)|dev(Device)}
Says: show a UI element labelled 'Prefix', with two values - "System" (which returns 'sys' to the query) and "Device" (which returns 'dev'), and the default value is System. Zeppelin renders this as a dropdown, with the results underneath:
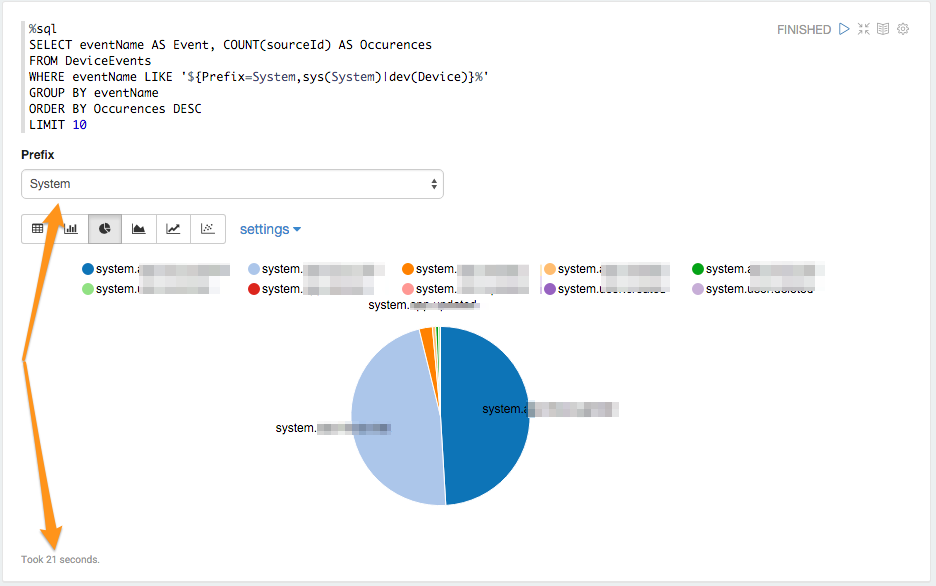
As this is an interactive query, when the user changes the value of the dropdown the query is run again and the new results are displayed when the query completes. Note that this query took 21 seconds, and the previous GROUP BY took 22 seconds - those query times are very similar for a reason.
Spark breaks query jobs into small tasks, and when a node runs a task it loads all the data it needs for the task into memory. That's why Spark is so fast, making use of the huge speed advantage of RAM over local or remote disk.
These are simple queries over a small data set, so much of the cost is in loading the files into memory from disk. Once they've been loaded, the task execution is very fast.
There's plenty more you can do with Spark and Zeppelin, which I'll be covering in later posts. But we've seen the basics for building a user-facing dashboard. The last thing I'll flag up - you can add simple UI elements with a markdown paragraph %md, and you can hide all the code in the Notebook so the users would see something like this:
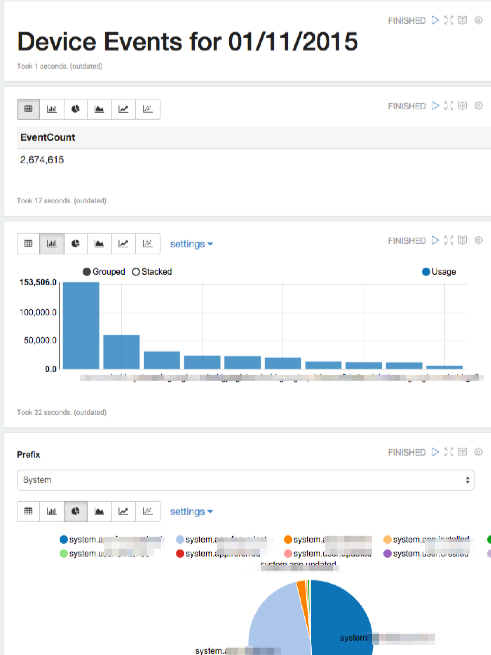
That's a pretty rich dashboard, showing useful data from potentially billions of events, with just two lines of Scala and a few SQL queries.