
Site Reliability Engineering (SRE) on Pluralsight: Complete 4-Course Learning Path
Site Reliability Engineering is how Google runs production systems, and it’s becoming the standard approach for managing complex applications at scale. I’ve just published the first two courses in a new SRE learning path on Pluralsight, with two more courses coming soon to complete the path.
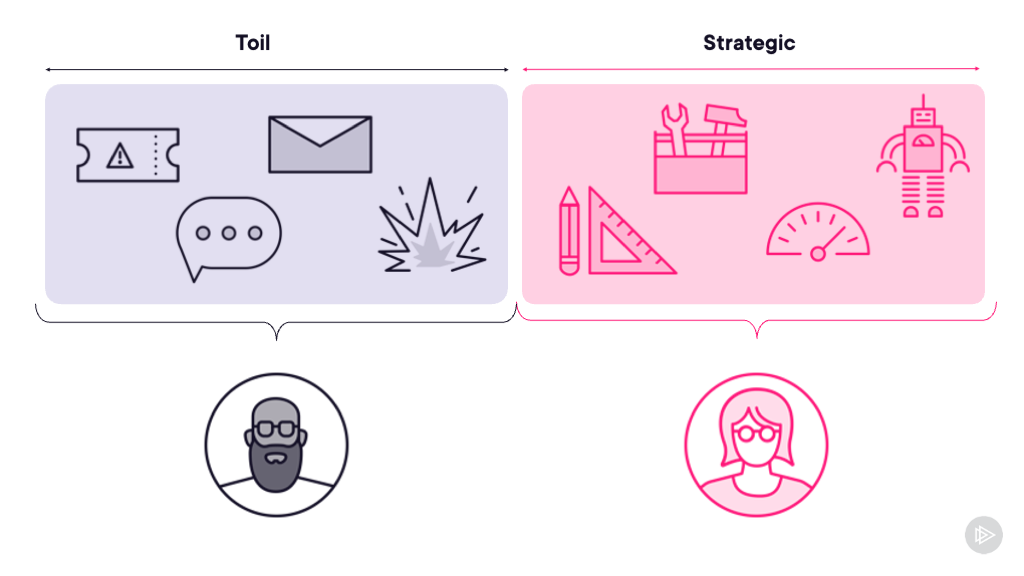
SRE achieves the same goals as DevOps - high availability with high velocity - but without requiring a massive culture shift. It’s an engineering approach to operations that focuses on automation, measurement, and removing toil. For many organizations starting their digital transformation, SRE provides a more structured path forward than traditional DevOps adoption.
I cover the easy(ish) way to add reliability at scale with container orchestration in my 5* Pluralsight course Managing Apps on Kubernetes with Istio.
The SRE Learning Path
The complete Site Reliability Engineering learning path takes you from SRE fundamentals through to advanced practices:
- SRE: Concepts and Principles
- SRE: Monitoring and Observability
- SRE: Resiliency and Automation
- SRE: Measuring and Optimizing Reliability (coming soon)
Let’s dive into what’s covered in the first two courses.
Course 1: SRE Concepts and Principles
SRE: Concepts and Principles is your entry point into Site Reliability Engineering. Over 90 minutes, you’ll follow two experienced SREs as they deal with real production scenarios.
What You’ll Learn
The course covers the foundational SRE concepts through practical demonstrations:
- How SRE differs from traditional IT operations and DevOps
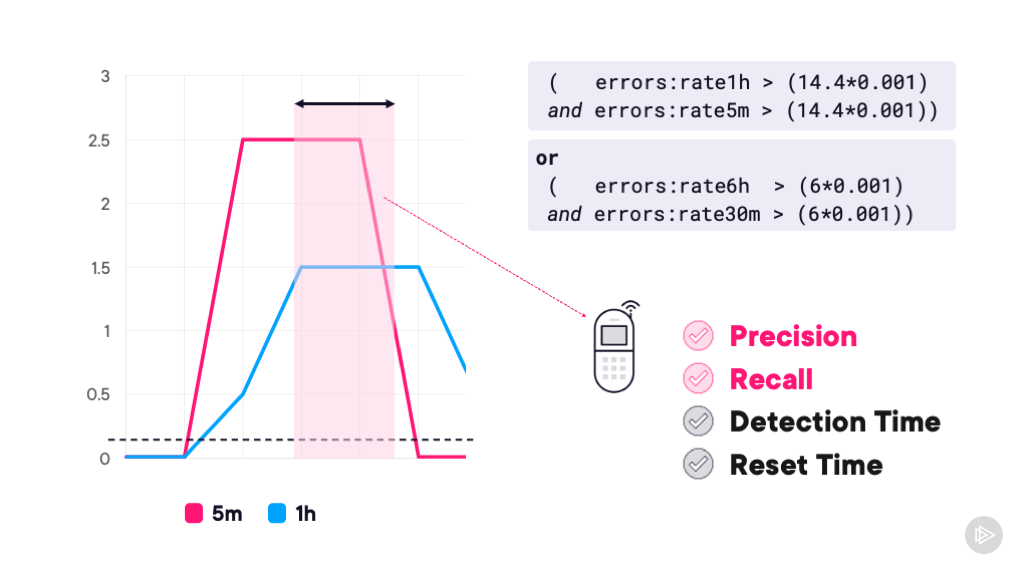
- Service Level Indicators (SLIs), Service Level Objectives (SLOs), and error budgets
- Incident management and the importance of blameless postmortems
- Core SRE tools for monitoring and alerting
- Automation, automation, automation
Course Outline
Module 1: Investigating Issues: On-Call with an SRE
Follow an on-call SRE dealing with a disk space issue in Elasticsearch. You’ll see how SREs approach problems differently from traditional ops teams, using engineering practices to solve operational challenges.
Module 2: Classifying and Tracking Performance with Service Levels
Join another SRE investigating a performance issue that’s burning through error budget. This module explains the key concepts of SLIs and SLOs while demonstrating logging and distributed tracing tools.
Module 3: Managing Risk and Reducing Downtime
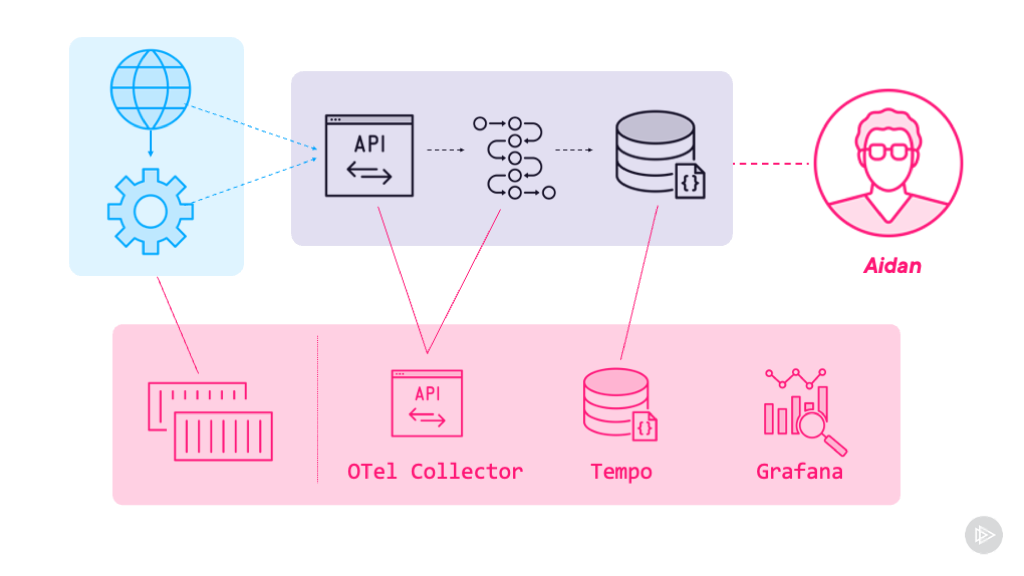
Learn how to use monitoring tools like Prometheus and Grafana with OpenTelemetry to confirm root causes and work with development teams on architectural solutions.
Module 4: Handling Failure with Incident Management
When the initial fix doesn’t work and the incident escalates, you’ll see how SREs use a structured incident management approach to investigate and get to quick resolution.
Module 5: Reflecting and Improving Practices with Postmortems
Wrap up with a blameless postmortem that connects both incidents and provides a path forward for preventing future issues.
Course 2: SRE Monitoring and Observability
SRE: Monitoring and Observability builds on the foundational knowledge from course 1. You’ll follow an SRE team preparing to onboard a new application into their production environment.
What You’ll Learn
This course focuses on the technical implementation of observability:
- The three pillars of observability: logging, metrics, and tracing
- Setting up monitoring stacks with Elasticsearch, Prometheus, and Grafana
- Designing effective alerting strategies that avoid alert fatigue
- Automating incident response with CI/CD pipelines
- Exploring AIOps and machine learning for advanced monitoring
Course Outline
Module 1: Onboarding to SRE: Observability Requirements
Learn what data applications need to expose for SRE teams to manage them effectively. Covers structured logging with the EFK stack and distributed tracing with Tempo.
Module 2: Measuring “Good” with Service Level Indicators
Deep dive into implementing meaningful SLIs using Prometheus, including how to expose metrics from application components and aggregate them for monitoring.
Module 3: Alerting on “Bad” to Trigger Incident Response
Design alerting strategies that trigger the right response - automated fixes for known issues or pages for unknown problems. Includes integration with OpsGenie.
Module 4: Automating Remediation with Pipelines
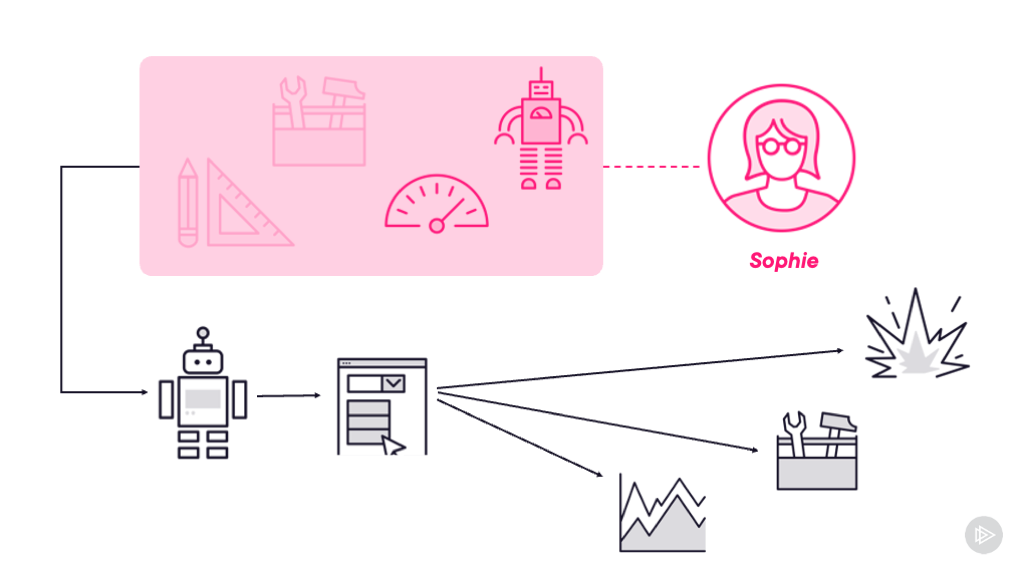
Reduce toil by automating common fixes using GitHub Actions workflows triggered by your monitoring stack, with status updates posted to Slack.
Module 5: Next-level SRE: Machine Learning and AIOps
Explore how AIOps platforms like Datadog can augment traditional SRE practices with machine learning-driven anomaly detection and automated incident analysis.
Real-World Tools and Practices
Both courses use the same tools you’ll find in production SRE environments:
- Monitoring: Prometheus, Grafana
- Logging: Elasticsearch, Kibana, Fluentd
- Tracing: Tempo, OpenTelemetry
- Alerting: OpsGenie, PagerDuty
- AIOps: Datadog
Every demo shows working implementations to back up the theory. You’ll see realistic incidents being investigated, actual dashboards being built, and automation workflows in action.
Who Should Take These Courses?
The courses are designed for:
- Developers who work with SRE teams or want to understand SRE practices
- Operations engineers looking to transition to SRE
- Team leads and managers evaluating SRE for their organization
- Anyone involved in digital transformation initiatives
No deep technical knowledge is required for the first course - just a basic understanding of software development and deployment processes.
What’s Next?
The next two courses in the learning path will complete your SRE education:
SRE: Resiliency and Automation will focus on building systems that can withstand failures and automating responses to common issues. You’ll learn how to design for resilience, implement chaos engineering practices, and create self-healing systems.
SRE: Measuring and Optimizing Reliability will cover advanced techniques for quantifying and improving system reliability, including complex SLO hierarchies, reliability budgeting, and using data to drive architectural decisions.
Getting Started
Ready to learn how Google keeps systems running at scale? Start your Site Reliability Engineering journey today:
- View the complete SRE learning path - See all 4 courses and plan your learning
- Start with SRE: Concepts and Principles - Master the fundamentals (90 minutes)
- Continue with SRE: Monitoring and Observability - Implement real-world solutions
Site Reliability Engineering isn’t just for Google-scale operations. These SRE principles and practices work for any team running production systems. Whether you’re managing a handful of microservices or hundreds, SRE provides a proven framework for balancing reliability with feature velocity and reducing operational toil.
Frequently Asked Questions
Q: Do I need prior SRE experience to take these courses?
A: No, the first course starts with fundamentals. Basic software development and deployment knowledge is helpful.
Q: What tools will I learn?
A: Prometheus, Grafana, Elasticsearch, Kibana, Tempo, OpsGenie, and modern AIOps platforms like Datadog.
Q: How long does the complete learning path take?
A: The four courses total approximately 6 hours, designed to be completed over 2-3 weeks.
Q: Is this Google’s exact SRE approach?
A: These courses teach the core SRE principles Google pioneered, adapted for use in any size of organization.
Ready to dive deeper into the tools and practices that make SRE possible? Check out my other courses on Pluralsight covering Docker, Kubernetes, and cloud-native architecture.
Comments