Tracing External Processes with Akka.NET and OpenTelemetry: Part 1 (The Code)
Distributed tracing is one of the most useful observability tools you can add to your products. Digging into the steps of some process to see what happened and how long everything took gives you a valuable debugging tool for distributed systems. It’s usually straightforward to add tracing to HTTP components - you can get a lot of the work for free if you use a service mesh like Istio - but I had an interesting problem where I wanted to monitor processes running in an external system.
I cover the easy(ish) way to do this with HTTP services, and look at the benefits of observability in my 5* Pluralsight course Managing Apps on Kubernetes with Istio.
The system is a risk calculation engine. It has a REST API where you submit work and check on progress, but it doesn’t expose much useful instrumentation. When we submit a piece of work it goes through several stages, which range in duration from 5 minutes to several hours. In that time we can poll the API for a progress report, but we just get a snapshot of the current status, we don’t get an overall picture of the workflow.
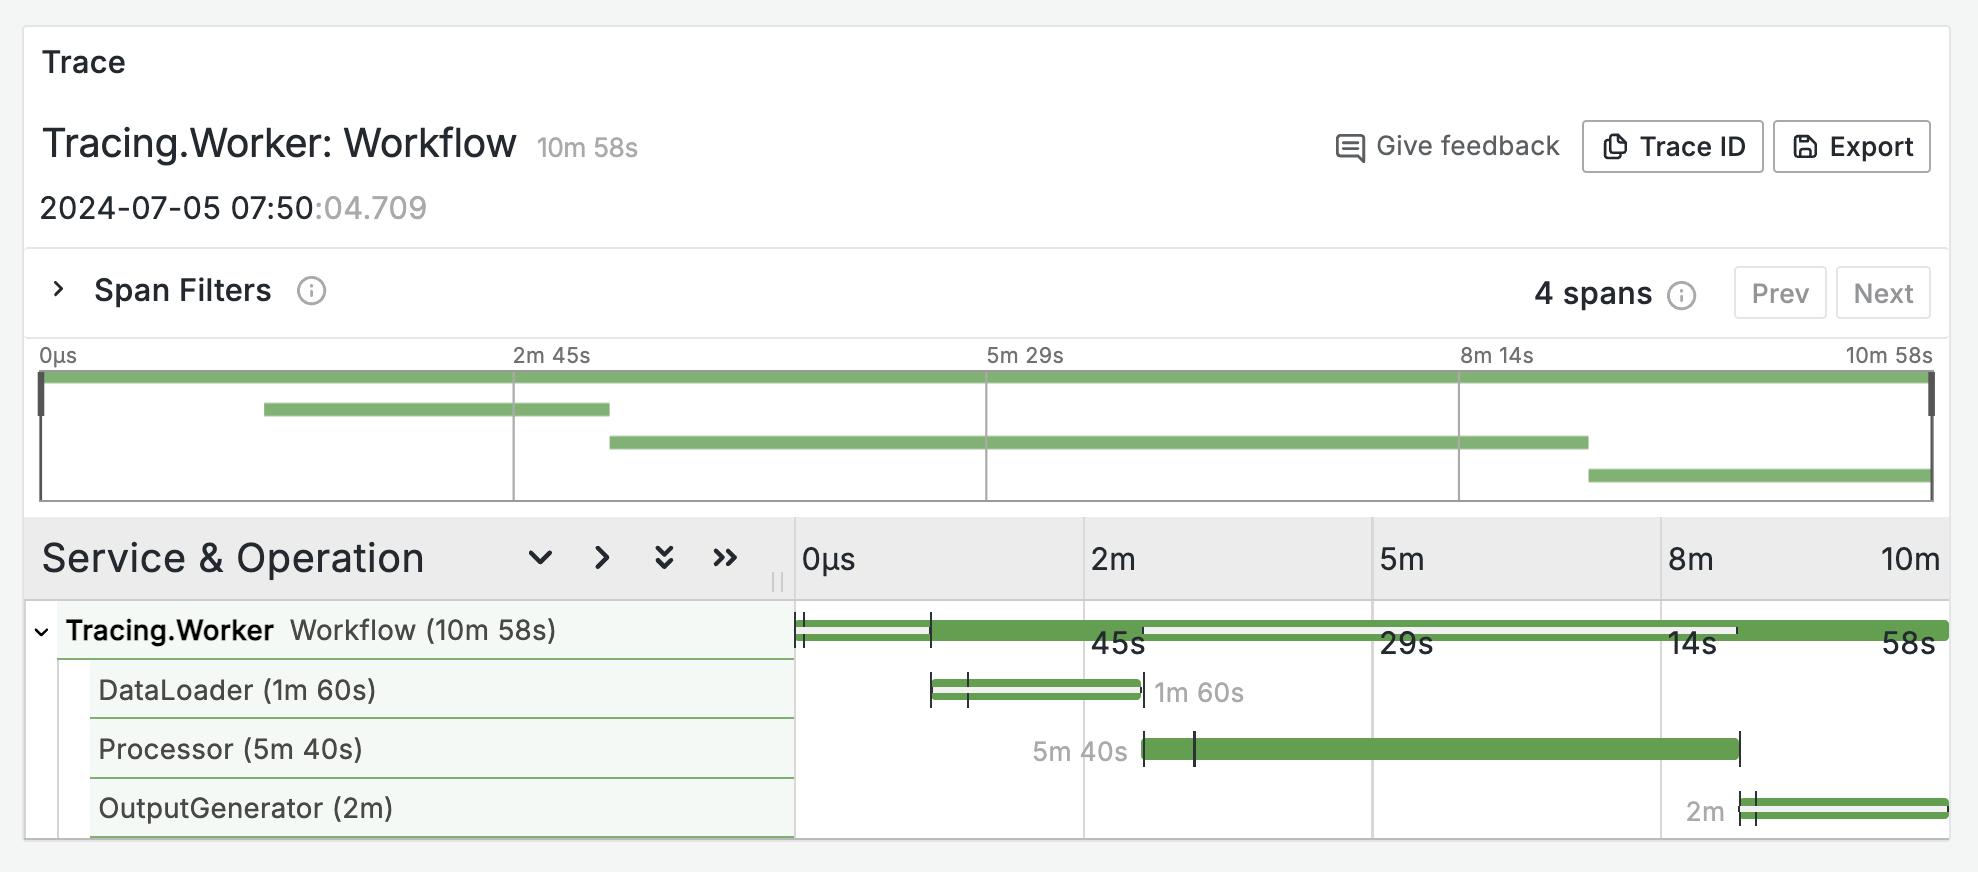
I wanted to capture the stages of processing as a tracing graph, so we could build a dashboard with a list of completed processes, and drill down into the details for each. Something like the classic Jaeger view:
Terminology
To make sense of the rest of this post (and the series), some definitions:
- each job we send to the calculation engine is called a Workflow
- each Workflow has several stages, represented in the API as a collection of Workflow Entities in the Workflow object
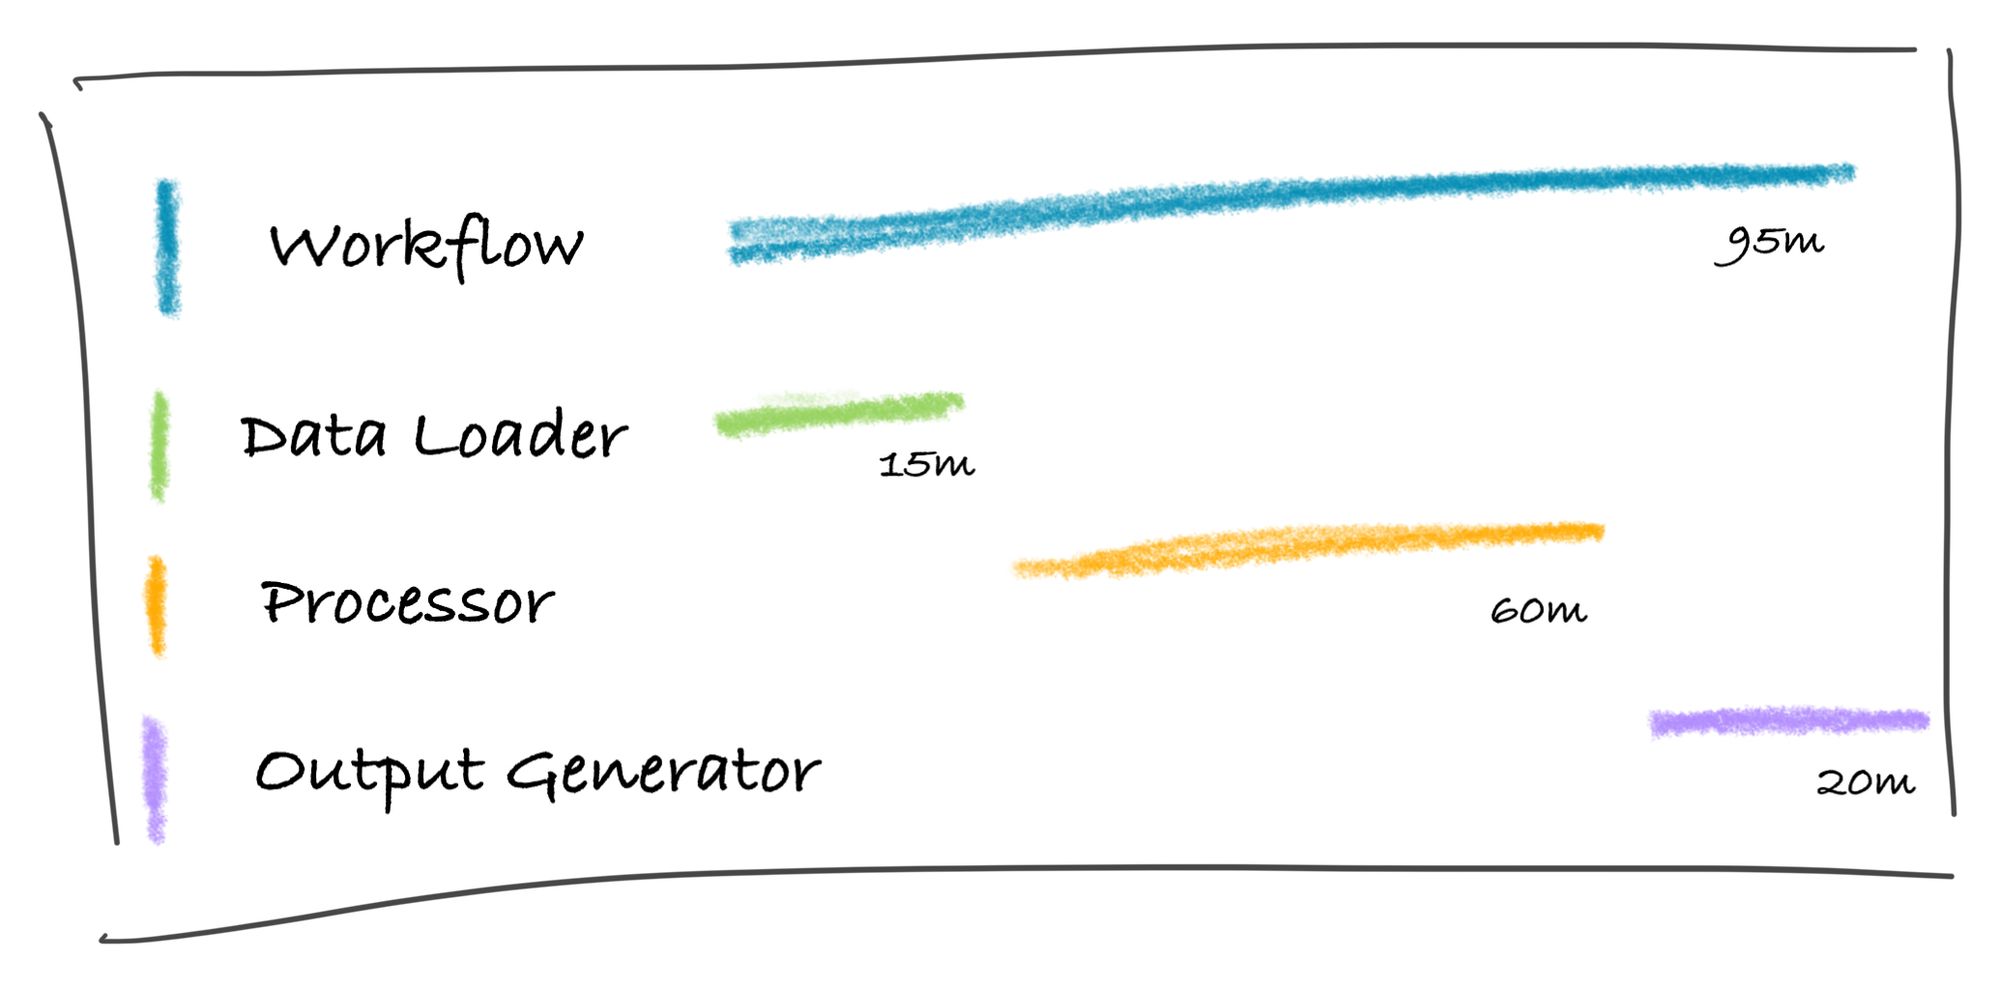
In the real system there are different categories of job, each of which creates a Workflow with a different set of Entities. For this series I’m using a simplified version where very workflow has three Entities which run in sequence:
- Data Loader, representing the initial setup of data, which typically takes from 2 to 10 minutes
- Processor, which is the real work and can take from 30 to 240 minutes
- Output Generator, which transforms the processor output into the required format and can take from 5 to 60 minutes.
I have a dummy API for testing which does nothing but reports on Workflow progress using random durations for each Entity.
Architecture
We’ve been live with the real system for a while so we have a good understanding of the workload. It’s pretty bursty with batches of processing coming in for a few hours, and then going quiet. During the batches we have a fairly small number of workflows, typically under 500. The external system breaks each Processor stage into tens of thousands of tasks (running on Spark), but we’re only interested in high-level progress of the Workflow and Entities. We also have a custom-built infrastructure around the external system, to publish events when we submit work, and a backend processor which listens for those events.
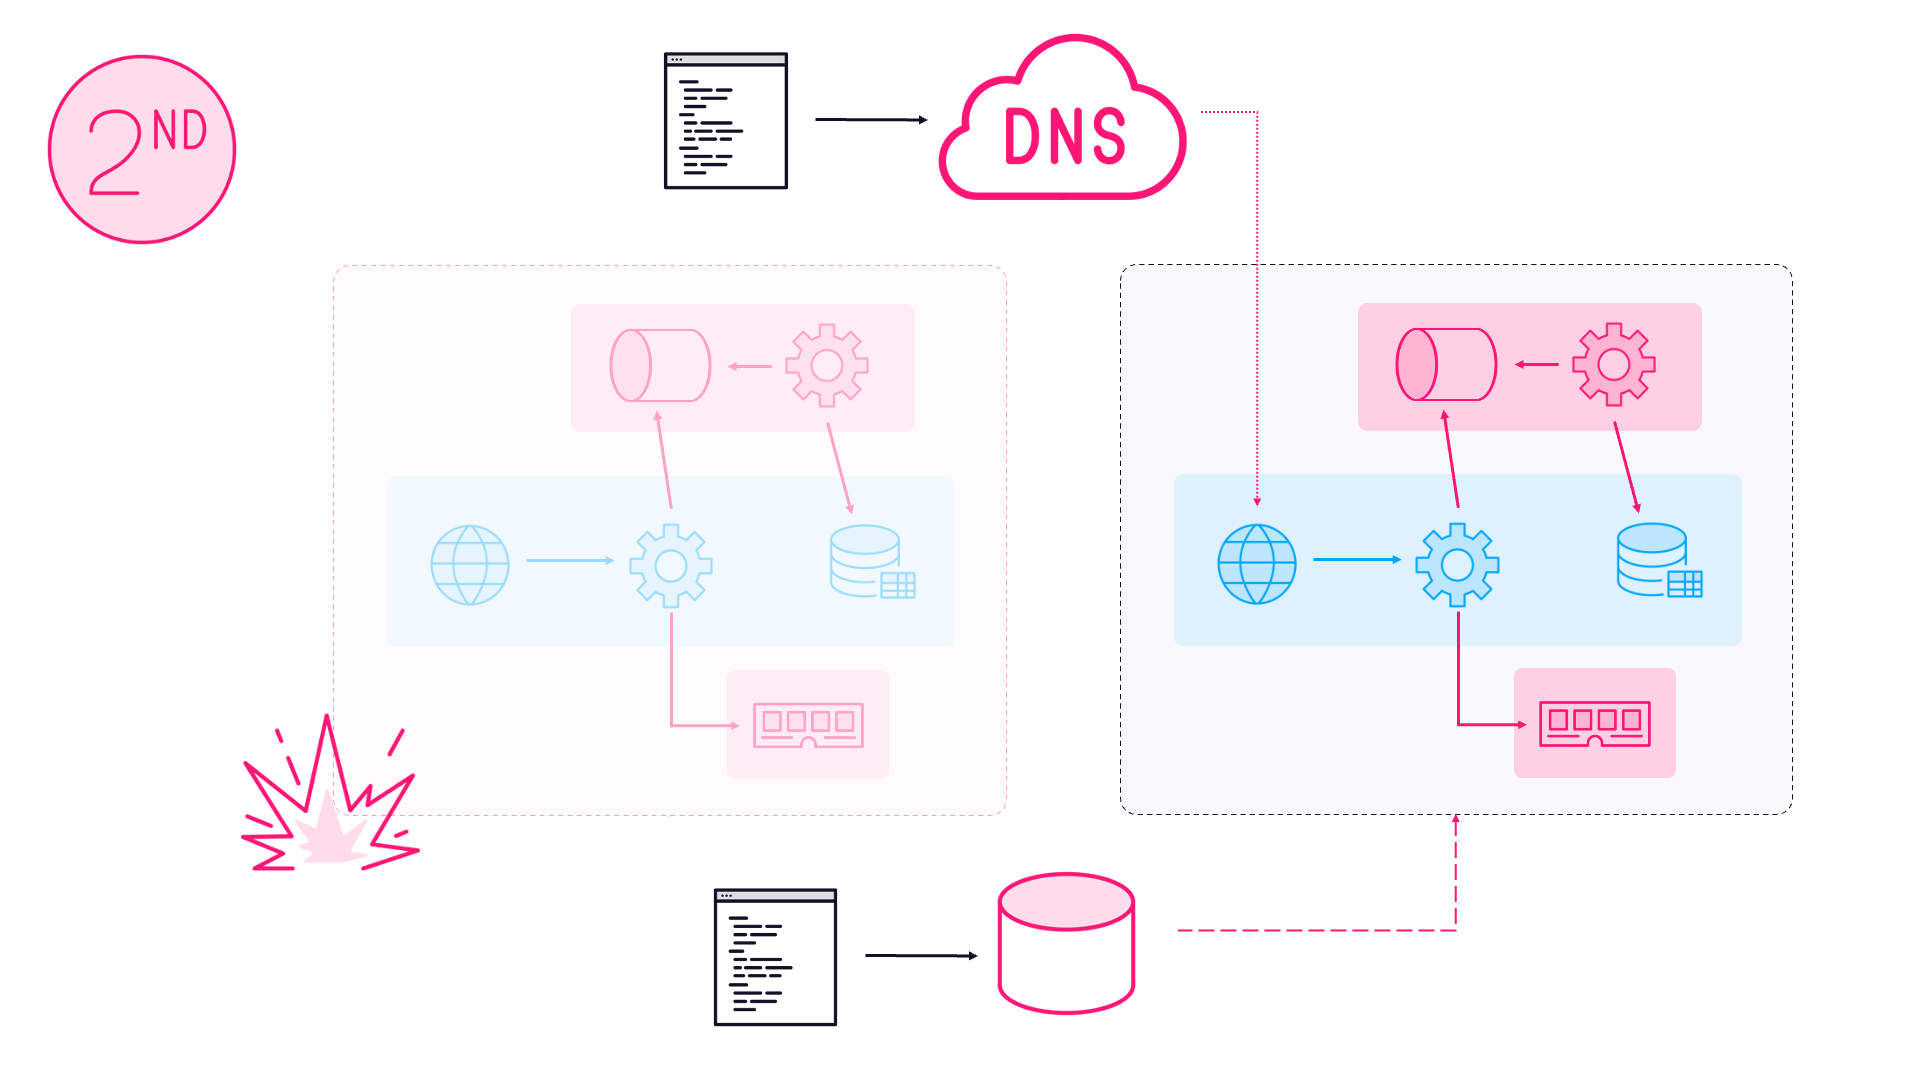
So to monitor the processes we need to spin up ~500 watchers which can poll the external system and track workflow progress. The actor model with Akka.NET is a great fit here; I can use one actor for each Workflow - and the Workflow actor in turn manages an actor for each Workflow Entity - and not have to worry about threads, parallelism, timers or managing lifetime. Here’s the overall design:
- register a supervisor process with Akka.NET and listen for “workflow started” event messages (which we already publish to Redis)
- on receipt of a message, the supervisor creates an actor to monitor that new Workflow
- each actor polls the external REST API to get the status of the Workflow, and as the stages progress it creates its own actors to monitor the Workflow Entities
- status updates are recorded in the actors using OpenTelemetry, stopping and starting spans for each Workflow Entity, linked to the overall trace for the Workflow.
I’ve published a full code sample on GitHub here if you want to see how it all fits together: sixeyed/tracing-external-worflows.
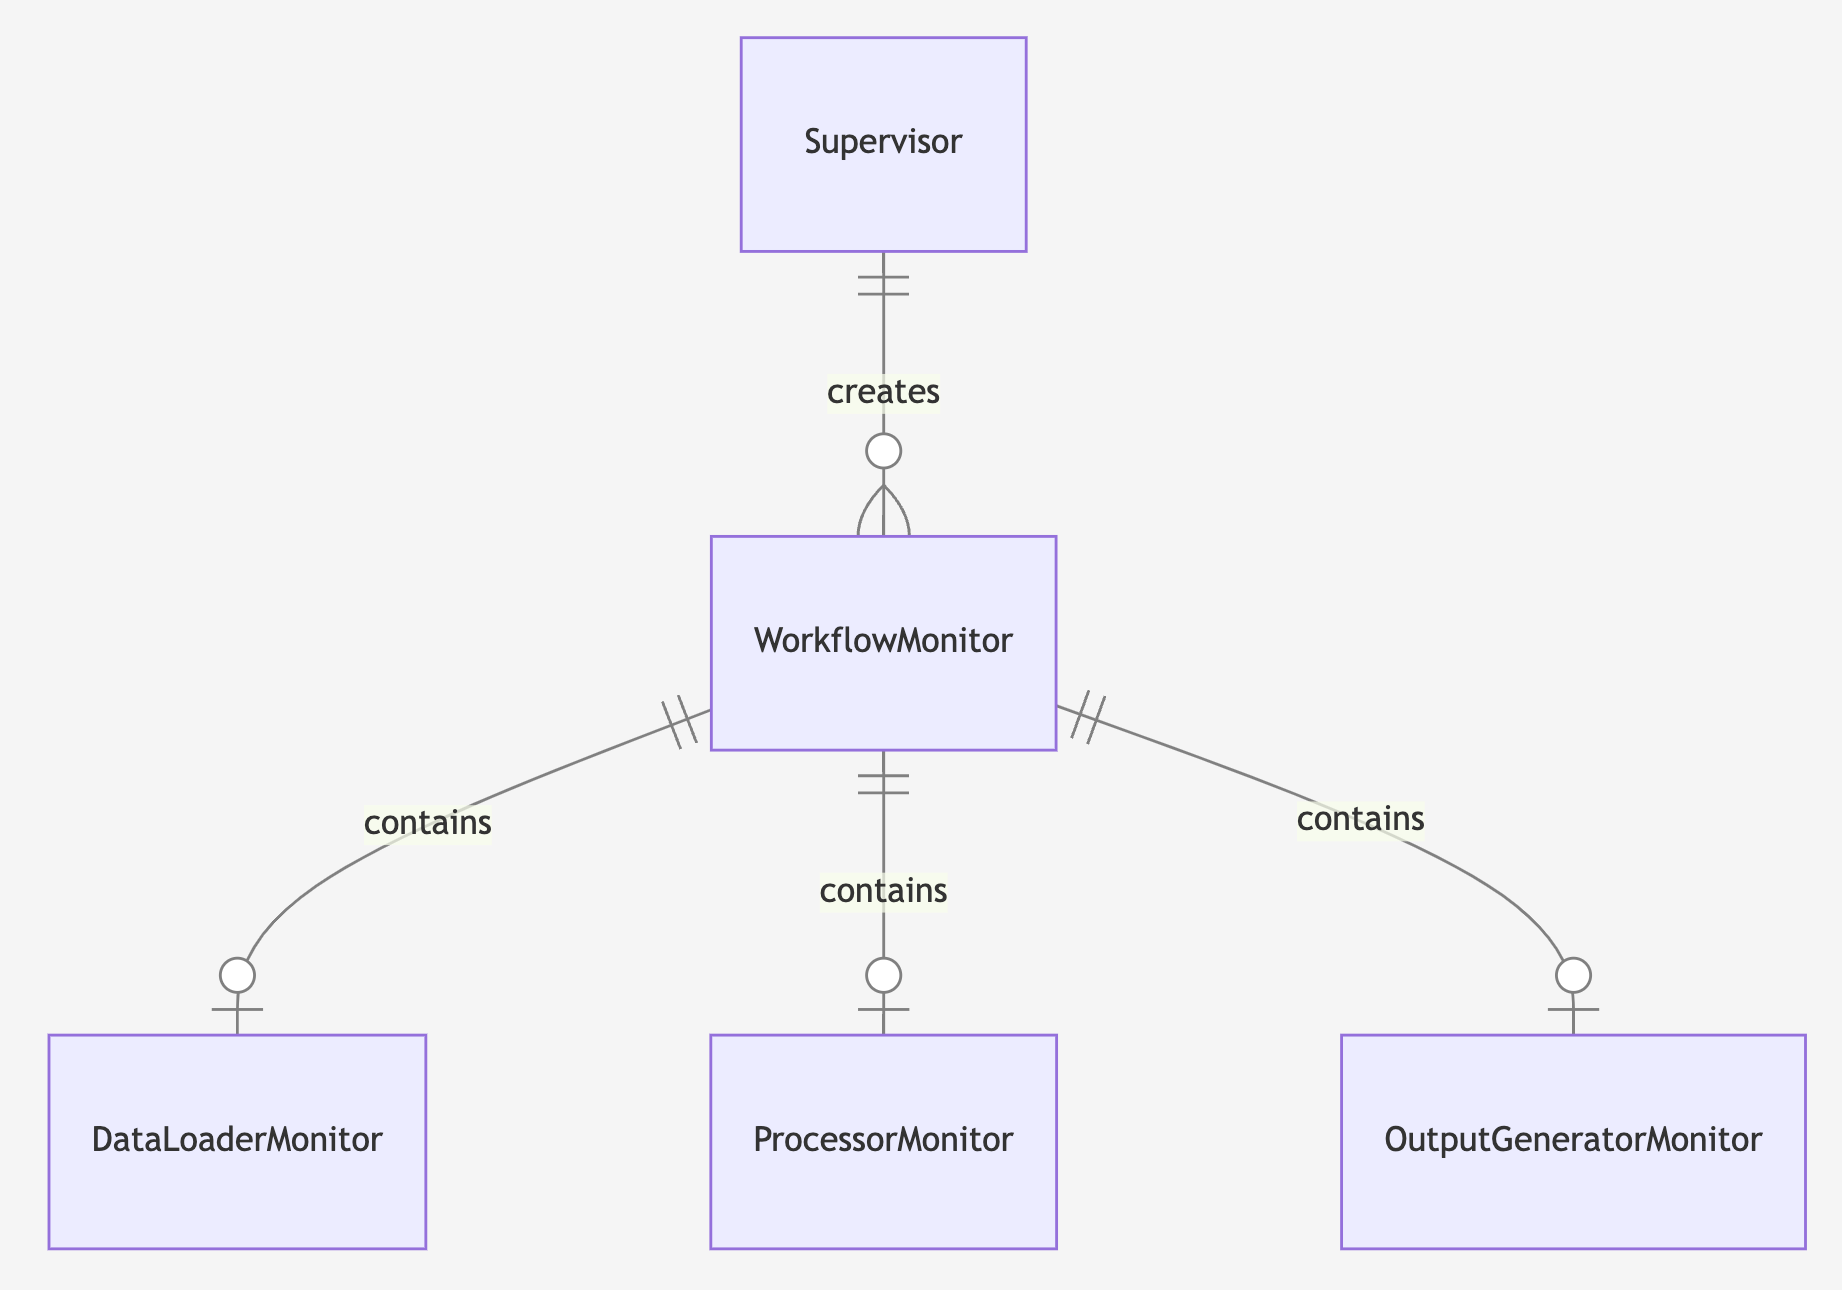
Towards the end of processing, each Workflow monitor actor has had three Entity monitor actors, one for each stage. The Workflow owns the overall trace, and in this example the spans for Data Loader and Processor would be complete, and the span for Output Generator would still be running:
Interesting Bits of Code
In the worker a background service runs which creates the supervisor actor and subscribes to Redis, listening for Workflow started messages. When it gets a message it sends it on to the supervisor:
_supervisor = _actorSystem.ActorOf(Props.Create<TSupervisor>(), ActorCollectionName);

_subscriber = _redis.GetSubscriber();
_subscriber.Subscribe(MessageType, (channel, value) =>
{
  var message = JsonSerializer.Deserialize<TStartedMessage>(value);
  _supervisor.Tell(message);
});
(The work happens in base classes because in the real system we actually have a few types of process we monitor - hence the generics - but in the sample code there’s just one type).
When the supervisor gets a “started” message, it spins up a monitor actor to watch the Workflow:
var id = started.GetId();
var props = DependencyResolver.For(Context.System).Props<TMonitor>();

var monitor = Context.ActorOf(props, id);
_monitors.Add(id, monitor);
monitor.Forward(started);
The monitor is loaded with the DependencyResolver, which connects the .NET Dependency Injection framework to Akka.NET. The monitor uses an Akka.NET periodic timer to trigger polling the external API for updates, and an additional one-off timer is also used as a timeout, so if the Workflow stalls (which can happen) we don’t keep watching it forever.
So the Workflow Actor responds to four message types - when the workflow starts, when an update is due, when the update is received and if the timeout fires:
Receive<TStartedMessage>(StartActivity);

ReceiveAsync<MonitorRefresh>(async refresh => await RefreshStatus());

Receive<TUpdatedMessage>(UpdateActivity);

Receive<MonitorTimeout>(_ => Terminate("Monitor timed out"));
When the refresh timer fires, the actor calls the external API to get the current status of the Workflow and its Entities. The client code is generated from the system’s OpenAPI spec and then wrapped in services. Those are all registered with standard .NET DI, and every call to the API uses a scoped client:
using (var scope = _serviceProvider.CreateScope())
{
  var workflowService = scope.ServiceProvider.GetRequiredService<WorkflowService>();
  workflow = await workflowService.GetWorkflow(EntityId);
}
_log.Info("Loaded workflow");
Each monitor actor tracks state using an Activity object, which is part of the .NET implementation of OpenTelemetry tracing. The Activity gets started when the actor is created, and updated when there’s a status update in the response from polling the API. The status updates include the current stage of the process, and for each stage the workflow monitor actor creates a Workflow Entity actor which has its own Activity linked to the parent Activity:
foreach (var entity in workflow.WorkflowEntities)
{
  var entityType = Enum.Parse<EntityType>(entity.Key);
  if (!_entityMonitors.ContainsKey(entityType))
  {
    var entityMonitor = Context.ActorOf(WorkflowEntityMonitor.Props(entityType, Activity), entity.Key);
    _entityMonitors.Add(entityType, entityMonitor);
  }
}
When the stage completes, the Workflow Entity actor ends the child Activity, ending the span, and sends a message to the workflow monitor actor to say this entity is finished with:
_activity.AddTagIfNew("endTime", entity.EntityEndTime);
if (string.IsNullOrEmpty(entity.EntityErrorMessage))
{
  _activity.SetStatus(ActivityStatusCode.Ok);
}
else
{
  _activity.SetStatus(ActivityStatusCode.Error, entity.EntityErrorMessage);
}

_activity.SetEndTime(entity.EntityEndTime.Value.DateTime);
_activity.Stop();

var ended = new WorkflowEntityEnded(_entityType);
Context.Parent.Tell(ended, Self);
And when all the Entities are done and the whole Workflow is finished, the parent Activity is ended which completes the trace and sends it on to the exporters. In the sample code I’ve configured the console exporter so traces get published as logs, and the OTLP exporter to send the traces to a real collector so you can visualize them:
Continue reading in Part 2: Running the Demo where I’ll show you how to run the sample app with Docker containers, collecting the traces with Tempo and exploring them with Grafana.
Comments