Tracing External Processes with Akka.NET and OpenTelemetry: Part 2 (Running the Demo)
In the last post I introduced a client project where I’m using OpenTelemetry and Akka.NET to collect traces for processes running in an external system. I’ve worked up a simplified demo on GitHub so you can see how it works for yourself.
Just a couple of pre-requisites and you can run this in Docker and/or Kubernetes:
- a Git client
- PowerShell (if you want to use my scripts)
- Docker Desktop
git clone https://github.com/sixeyed/tracing-external-workflows.git

cd tracing-external-workflows

./scripts/docker/run.ps1

# or if you don't have PowerShell:
# docker compose -f docker/docker-compose.yml -f docker/docker-compose-monitoring.yml up -d
That will start a bunch of containers running:
> docker ps

CONTAINER ID IMAGE COMMAND CREATED STATUS PORTS NAMES
3d48751c5ece redis:7.2-alpine "docker-entrypoint.s…" 8 minutes ago Up 8 minutes 0.0.0.0:6379->6379/tcp tracing-sample-redis-1

133d27dc8536 sixeyed/tracing-sample-external-api:202407-linux-arm64 "dotnet /app/Externa…" 8 minutes ago Up 8 minutes 0.0.0.0:5010->8080/tcp tracing-sample-api-1

d8259aeef523 grafana/tempo:2.5.0 "/tempo -config.file…" 8 minutes ago Up 8 minutes 0.0.0.0:4317->4317/tcp tracing-sample-tempo-1

2df5bbb547b7 grafana/grafana:11.0.0 "/run.sh" 8 minutes ago Up 8 minutes 0.0.0.0:3000->3000/tcp tracing-sample-grafana-1

668c8eeefb01 sixeyed/tracing-sample-worker:202407-linux-arm64 "dotnet /app/Tracing…" 8 minutes ago Up 8 minutes tracing-sample-worker-1

2b26bc987791 sixeyed/tracing-sample-load-generator:202407-linux-arm64 "dotnet /app/Tracing…" 8 minutes ago Up 8 minutes tracing-sample-load-generator-1
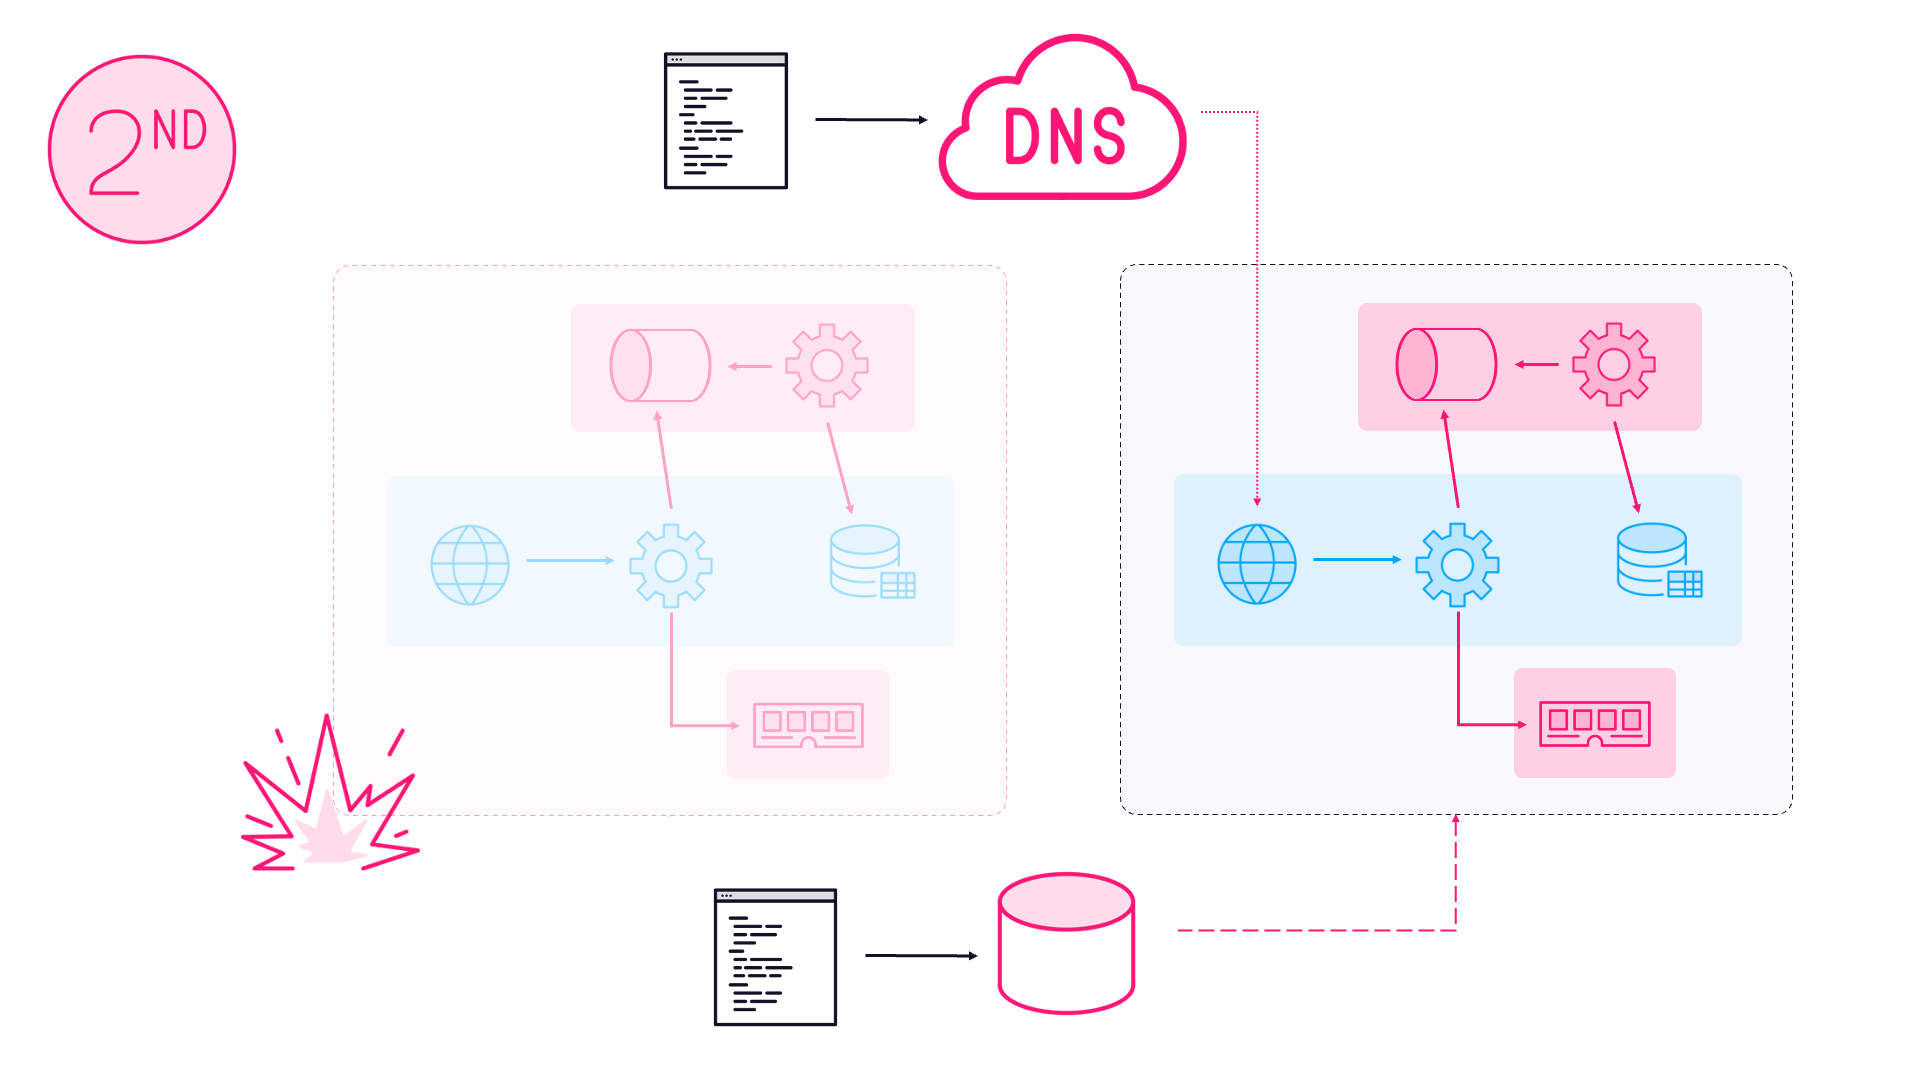
What we have here is the real stack for monitoring, and a dummy stack for generating data:
- the API just pretends to start Workflows; when a new Workflow is POSTed the API generates random durations for each of the stages and returns with a random ID. When the client checks the status of the Workflow the API responds with the current status based on the durations it calculated;
- the background worker is where the interesting stuff happens - this is the component which tracks the external Workflows, using Akka.NET actors for each Workflow and each stage. The actors poll the API and record OpenTelemetry spans as the stages progress;
- Redis is used in the real system to publish events - in the demo the background worker listens for WorkflowStarted events coming from Redis, and triggers the monitoring for each one;
- the Workflow Generator is a simple tool which simulates batch processing by publishing a bunch of WorkflowStarted events to Redis, which kicks off all the monitoring in the back end;
- Tempo is a collector for distributed traces, with a simple storage model. It replaces Jaeger or Zipkin and can ingest the standard OpenTelemetry protocols.
I use Jaeger in my 5* Pluralsight course - Getting Started with Istio but Tempo is nice alternative and integrates very well with Grafana.
- Grafana is configured to read trace data from Tempo. In the real system the worker collects additional metrics which we store in Prometheus, and this stack gives us a single UI for dashboards and trace visualization.
Exploring the Demo App
If you want to follow the logic through the different components, they all publish logs which you can see in Docker - the API lists the random durations it generates for each workflow:
> docker logs tracing-sample-api-1

dbug: External.Api.WorkflowEntityStateMachine[0]
      DataLoader: 9f623b49-1a25-4759-bc2e-f1bcca307a50 will transition to status: Processing; after: 13s
dbug: External.Api.WorkflowEntityStateMachine[0]
      DataLoader: 9f623b49-1a25-4759-bc2e-f1bcca307a50 will transition to status: Completed; after: 168s
dbug: External.Api.WorkflowStateMachine[0]
      Workflow: e730bcce-609f-494d-860e-84af7df37ccf added new entity: DataLoader
dbug: External.Api.WorkflowEntityStateMachine[0]
      DataLoader: b1bc2564-66d0-46b4-9564-7a6da7f74a27 transitioned to status: Completed</code></pre>
And the worker lists the tracing activity:
> docker logs tracing-sample-worker-1

Creating monitor actor for: 3e2fef36-109f-4f99-af10-bc7670b4f997
Monitor: WorkflowMonitor starting; initialDelaySeconds: 5; intervalSeconds: 10; timeoutMinutes 10
Started activity. Is recording: True
Set activity tags
Refresh timer triggered
Loaded workflow
Updating entity
Update received
The worker is configured with two exporters - the console exporter prints traces when they complete, and the OTLP Exporter sends data to Tempo (set up using the OTEL_EXPORTER_OTLP_PROTOCOL and OTEL_EXPORTER_OTLP_ENDPOINT environment vairables). It’ll take a few minutes for the dummy Workflows to start completing, and when they do you’ll see log entries like this in the worker from the console exporter - in this example the Workflow ended with an error state:
Stopped activity, status: Error
Stopping WorkflowEntityMonitor actor for: DataLoader
Activity.TraceId: 28036142016d8fe90492dd49328d484f
Activity.SpanId: 94ca096e5110ef7c
Activity.TraceFlags: Recorded
WorkflowEntityMonitor stopped
Activity.ActivitySourceName: sample-tracing
Workflow finished; all entity monitors finished
Activity.DisplayName: Workflow
Terminating
Activity.Kind: Internal
Activity.StartTime: 2024-07-05T06:57:51.0737407Z
Activity.Duration: 00:01:05.0139422
Activity.Tags:
    workflowId: 704c0b60-3614-4e54-8985-5134cc20df22
    startTime: 07/05/2024 06:57:56 +00:00
    endTime: 07/05/2024 06:58:56 +00:00
StatusCode: Error
Activity.StatusDescription: Entity failed: DataLoader
Activity.Events:
    Submitted [07/05/2024 06:57:51 +00:00]
    Initializing [07/05/2024 06:57:56 +00:00]
    Processing [07/05/2024 06:58:06 +00:00]
    Failed [07/05/2024 06:58:56 +00:00]
Resource associated with Activity:
    service.name: Tracing.Worker
    service.namespace: dev1
    service.version: 1.0.0
    service.instance.id: c73a7c0d-72c1-4cb2-839f-a3b233085bf2
    telemetry.sdk.name: opentelemetry
    telemetry.sdk.language: dotnet
    telemetry.sdk.version: 1.8.1
All the data in the activity filters into Tempo and can be used for searches, so you can find individual workflows by ID, or check for failures within a given time period. The namespace tag is very useful for multi-tenant environments where you have different instances of the app pushing to a centralised monitoring stack.
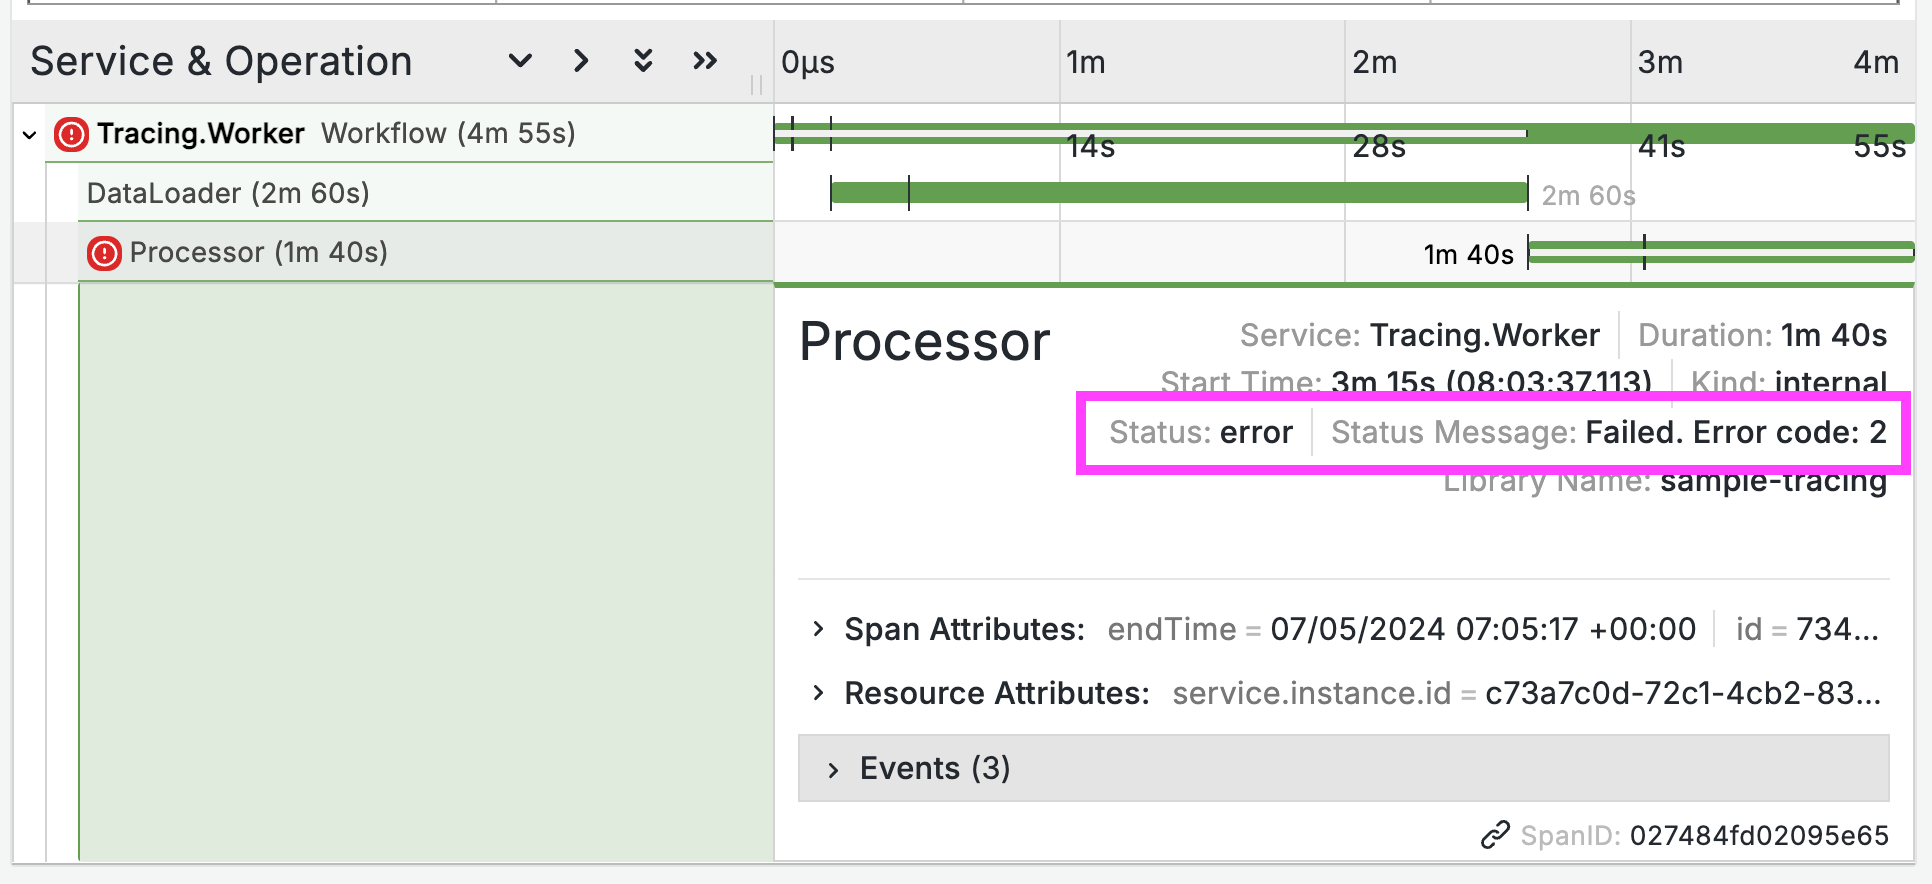
You can open Grafana at http://localhost:3000/explore - no credentials needed for this deployment. Tempo is already configured as a data source, so you can select the Search tab and explore the traces coming in:
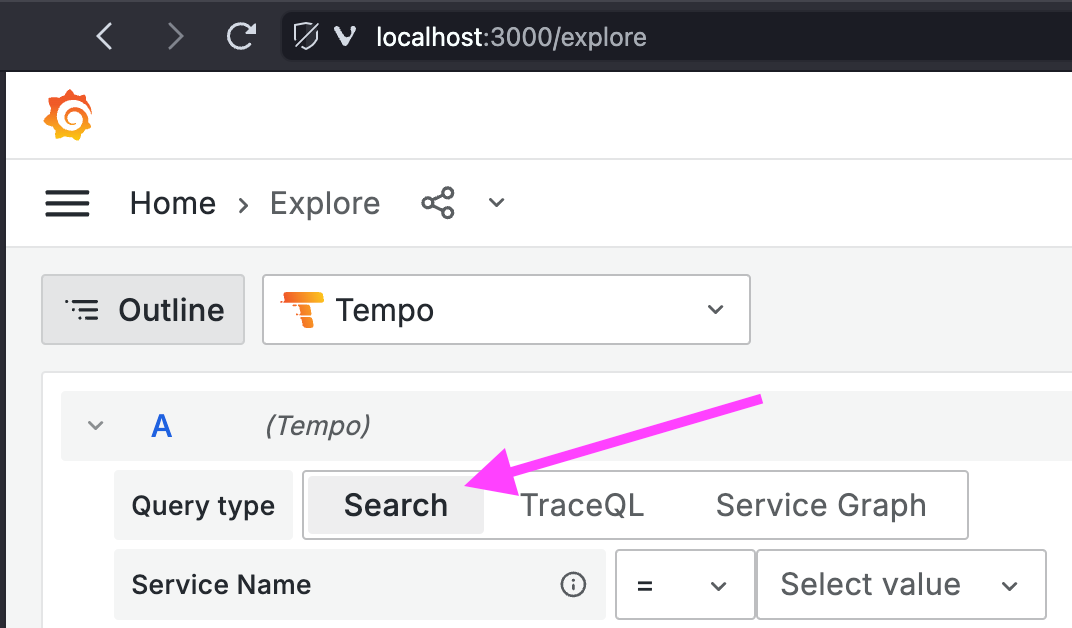
Traces aren’t shown in their entirety until all the child spans are complete, but when that happens you can drill into a Workflow to see the details:
The OpenTelemtry spec lets you record additional data with traces and spans as tags (arbitrary key-value pairs) and events (with timestamps). The Workflow monitor actor sets the key details when it starts the Activity:
Activity = Instrumentation.Tracing.ActivitySource.StartActivity(ActivityName, ActivityKind.Internal);

if (Activity != null)
{
  Activity.AddTagIfNew("workflowId", started.WorkflowId);
  Activity.AddEvent(new ActivityEvent("Submitted", new DateTimeOffset(started.SubmittedAt)));
}
Activity objects record the start time when you create them, but you can override that if you have more accurate data. In this case we get the real start time when we poll the external API, and we can set that in the update logic, along with any new tags. We also track changes in status as events:
Activity.SetStartTime(updated.GetStartTime());

Activity.AddTagIfNew("startTime", workflow.WorkflowStartTime)
        .AddTagIfNew("endTime", workflow.WorkflowEndTime);

var currentStatus = updated.GetStatus();
if (currentStatus != _lastStatus)
{
  Activity.AddEvent(new ActivityEvent(currentStatus));
  _lastStatus = currentStatus;
}
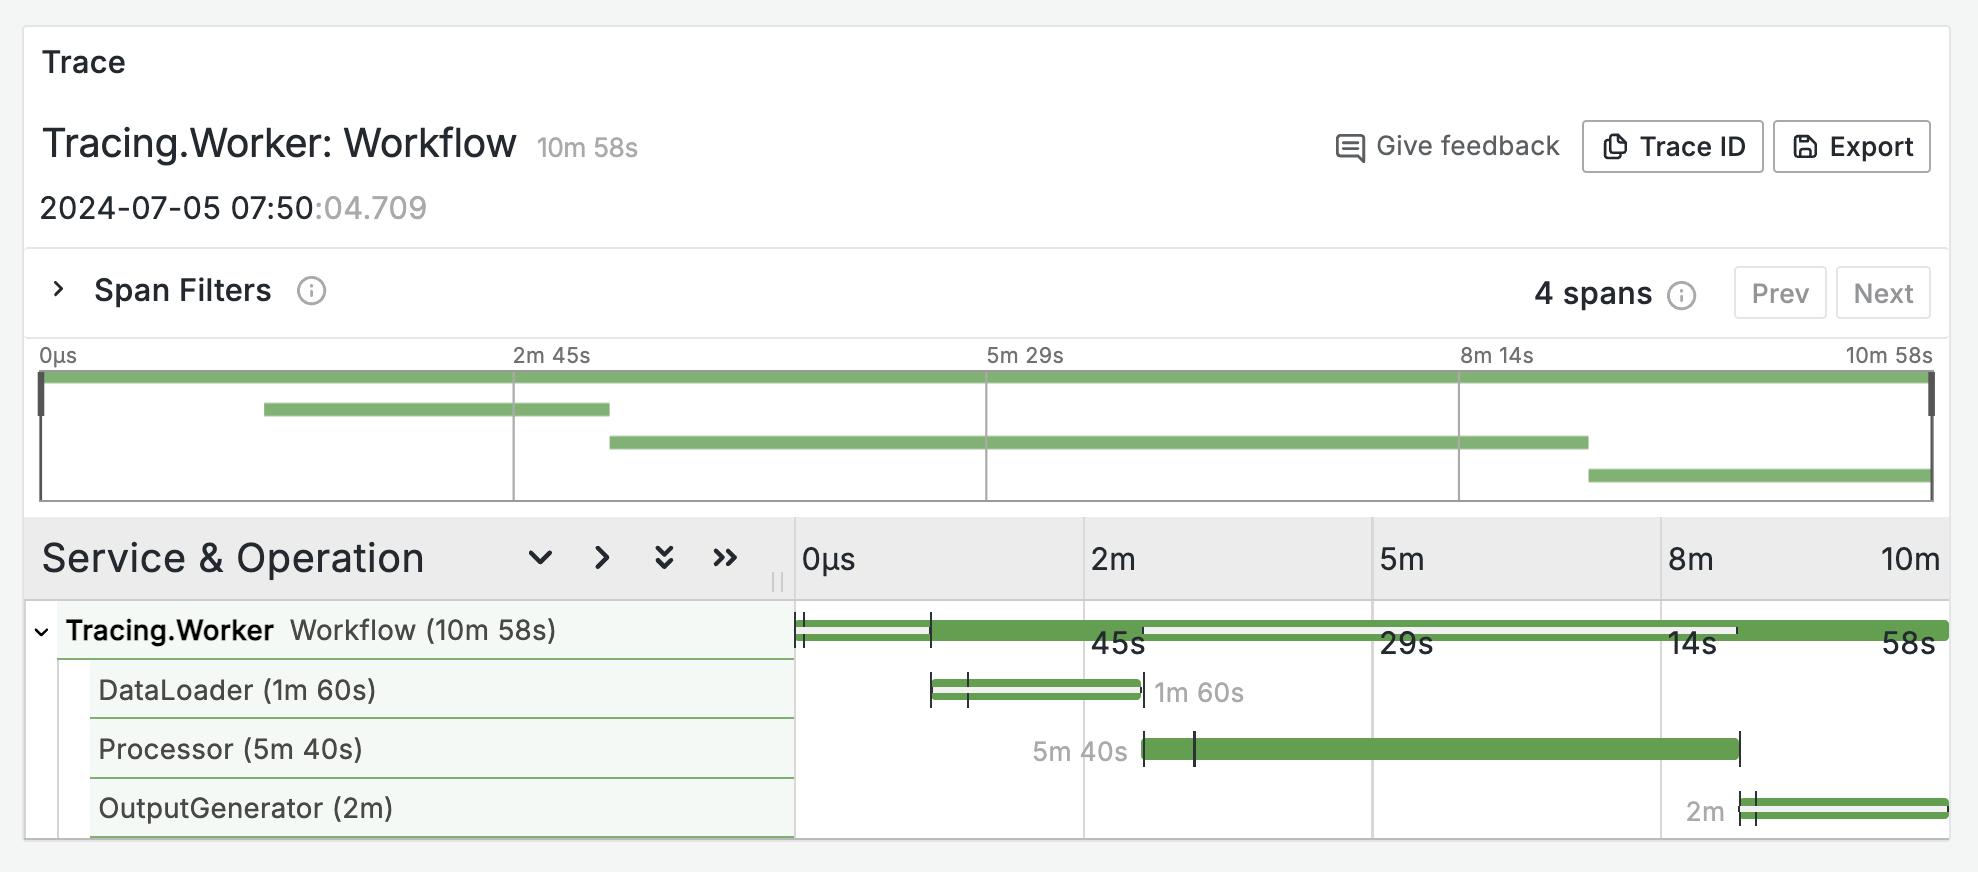
Those shows nicely in Grafana, showing the timestamp relative to the span:
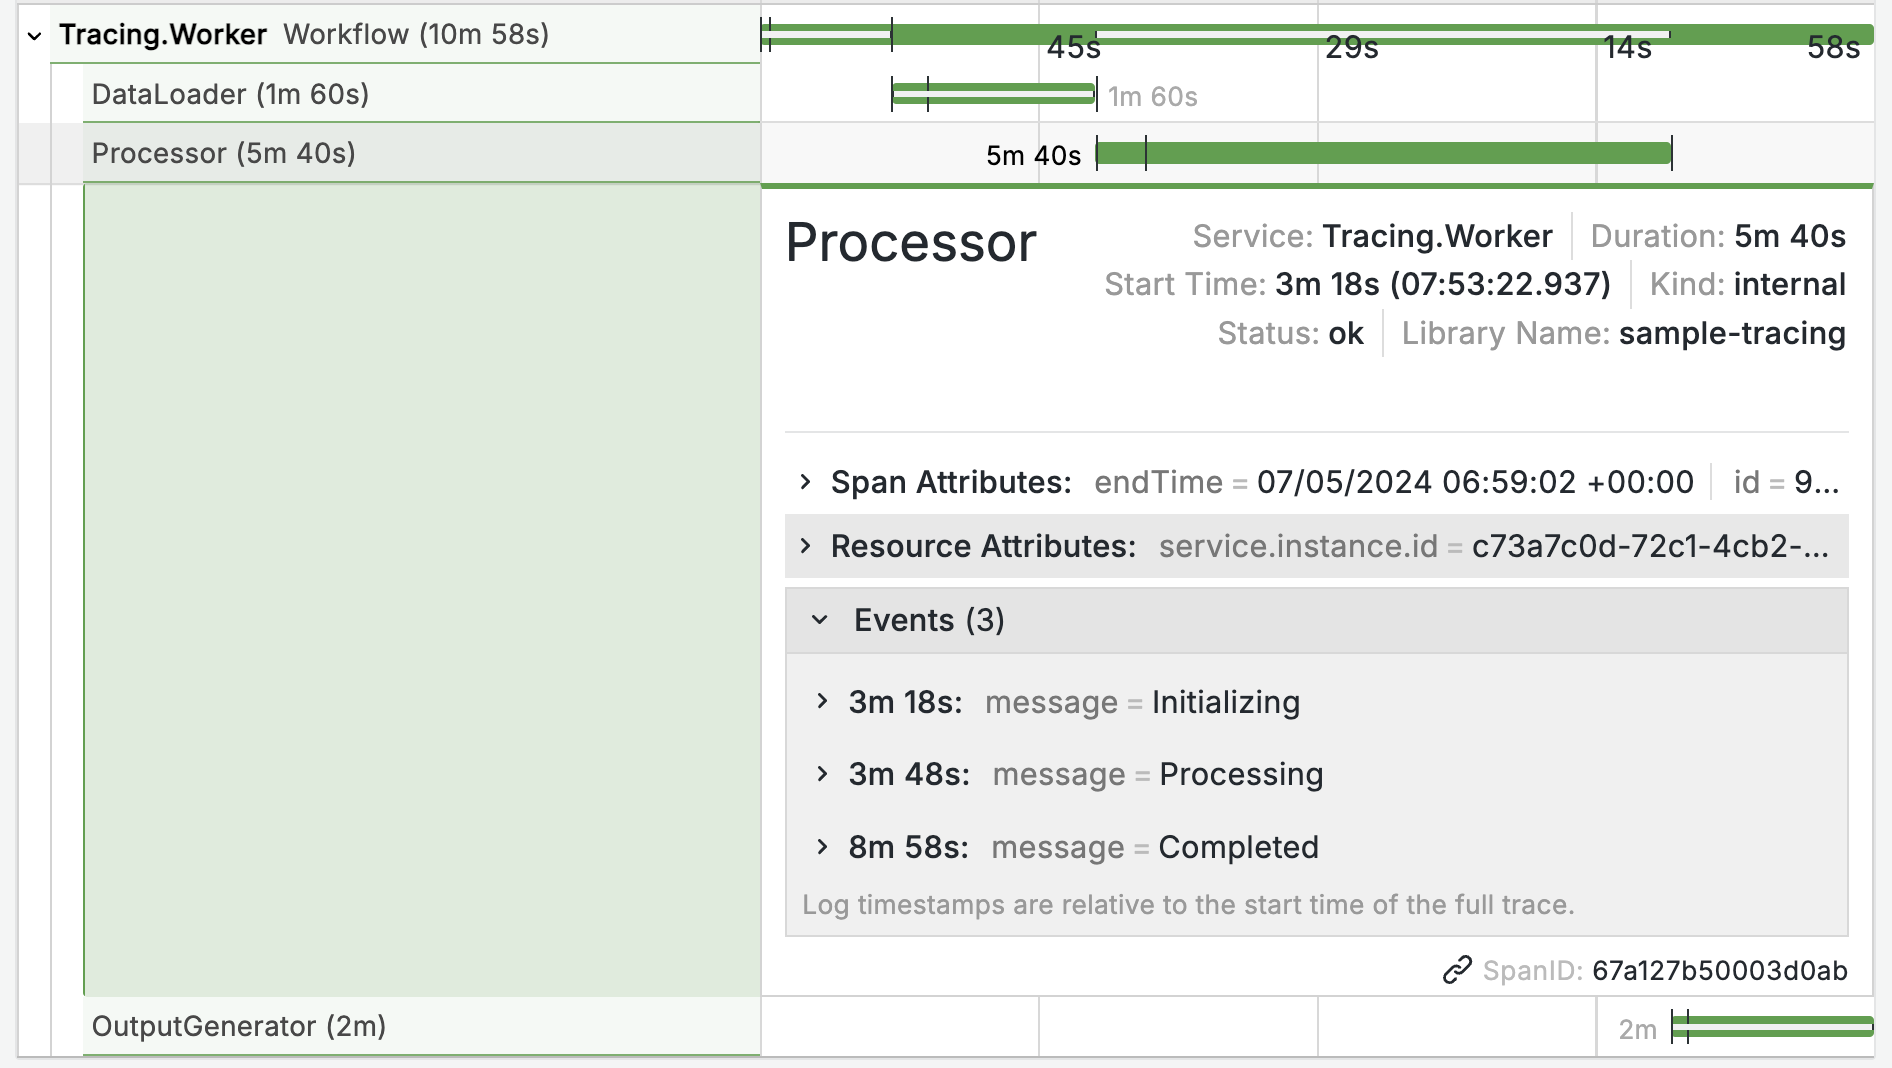
And finally when all the Entity processing has completed, we can end the Activity. The API can respond with a lengthy set of errors if there’s been a failure but we don’t need to record all that - just flagging the Activity with a status code of OK or Error will flow through into Tempo:
Activity.SetEndTime(updated.GetEndTime());
if (string.IsNullOrEmpty(errorMessage))
{
  Activity.SetStatus(ActivityStatusCode.Ok);
}
else
{
  Activity.SetStatus(ActivityStatusCode.Error, errorMessage);
}
Activity.Stop();
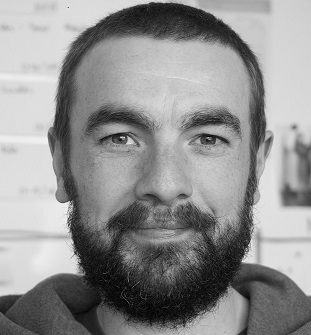
Tags and attributes can all be used for filtering in Grafana, so you can search for failures or build a dashboard with a table for errored workflows. In the detail you see the status and the error message:
On to Production
As always it’s great to be able to run this whole thing in Docker on a developer’s laptop, to prove out the process and make code changes quickly. The real system runs in Kubernetes on Azure, and next time I’ll walk through deploying the monitoring subsystem and the demo app using Helm.

Comments