
Monitoring Containerized Application Health with Docker
My latest Pluralsight course is live! This one covers all you need to know about monitoring apps when you’re running in Docker containers on Linux and Windows:
It comes in just under three hours, and it teaches you the whole theory and practice for monitoring containers - using the industry-standard tools Prometheus and Grafana.
This course works for those who identify as “ops” as well as those who identify as “dev”. One of the key benefits of monitoring apps in Docker is that developers can run up the monitoring stack locally and get the exact same metrics the ops team are using in production.
My demo apps for the course run Java on Linux containers, and .NET Framework on Windows containers. And I use standalone Docker engines (Docker Desktop for Mac and Windows, and Docker Engine on Ubuntu and Windows Server) and a hybrid Docker swarm running Linux and Windows nodes. So there should be something for everyone.
Here’s what the course covers (and if you don’t have a Pluralsight subscription, get in touch with me on Twitterand I can send you a trial code).
Architecting Monitoring for Containerized Apps
Monitoring is different when your app is running in hundreds of Docker containers compared to a few dozen servers. You don’t want to use “classic” monitoring tools like Nagios or SCOM because they aren’t designed for high-turnover, dynamically managed environments.
So instead of running an agent on your servers which pushes data to a central monitoring server, you expose metrics from your containers and your Docker servers, and run a monitoring component which polls those metrics and stores the results:
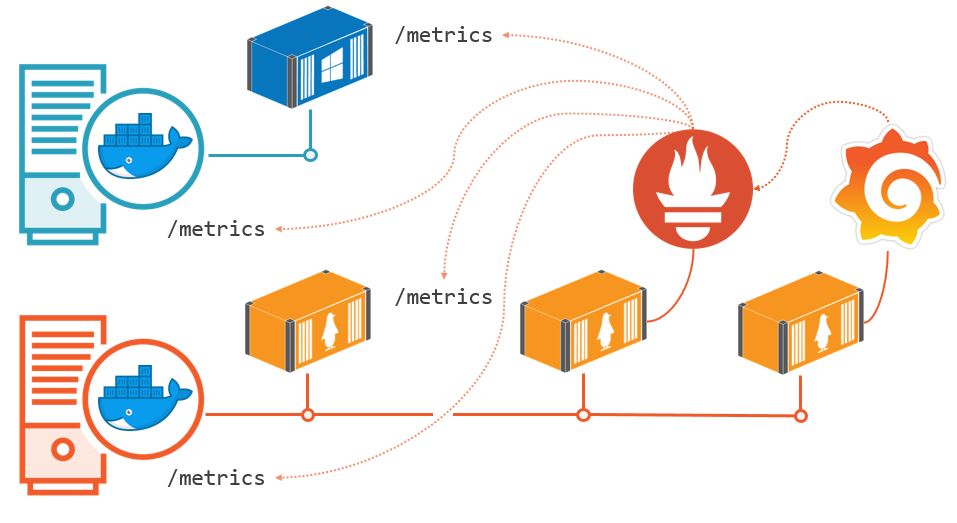
The standard metrics server is Prometheus, which stores data in its own time-series database. Then to visualize your application health you build a dashboard in Grafana, which shows key metrics from Prometheus in real-time, and for as far back as you need.
Prometheus and Grafana are mature open-source projects with huge user bases, and well-established support for running in Docker. They’re both featured in the CNCF Landscape, and Prometheus is a CNCF graduate project.
They’re new technologies to learn, but they’re pretty simple to get started with, and I cover everything you need to know in the course - including running Prometheus and Grafana in Docker containers on Linux and Windows.
Running your monitoring components in lightweight Docker containers means you can run the same metrics dashboard in every environment, and the architecture of pulling metrics from containers means you get a consistent view over different levels of your solution. In the course I cover:
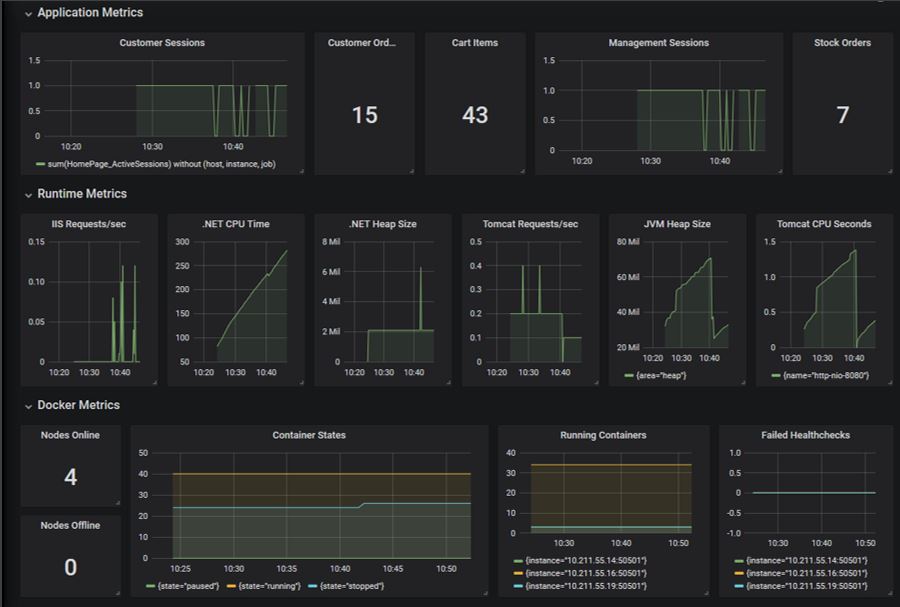
Application metrics - custom metrics you record which are valuable to see in the dashboard, like number of logged-in users or number of checked-out baskets.
Runtime metrics - data already collected by the operating system or runtime host, like the requests per second handled by a web server, or the memory usage.
Docker metrics - metrics from the container platform, including containers running in each state, node availability and healthchecks.
Collecting Metrics with Prometheus
Prometheus is a polling server, which makes HTTP requests to REST APIs that serve metrics (you can also push data into Prometheus, but that’s a less common pattern).
You can run Prometheus directly on the server, but it’s better to run it in Docker - that makes your Prometheus setup more portable, and it’s easier for Prometheus to discover polling targets using the DNS server built into Docker.
Prometheus is a great choice for your metrics server, because it has client libraries in most languages, and the Docker engine itself can expose metrics in Prometheus format.
I show you how to configure service discovery in Prometheus for containers and for the Docker engine, both in standalone mode and in swarm mode.
In swarm mode Docker supports container discovery with DNS queries which give you the IP addresses of all the containers for a service.
Exposing Runtime Metrics to Prometheus
It’s likely that the runtime hosting your app is already collecting metrics, and you can expose them from your containers without changing code.
I show you how to package a metrics exporter alongside the application in your Docker image, which is a utility that provides the /metrics API for Prometheus to read:
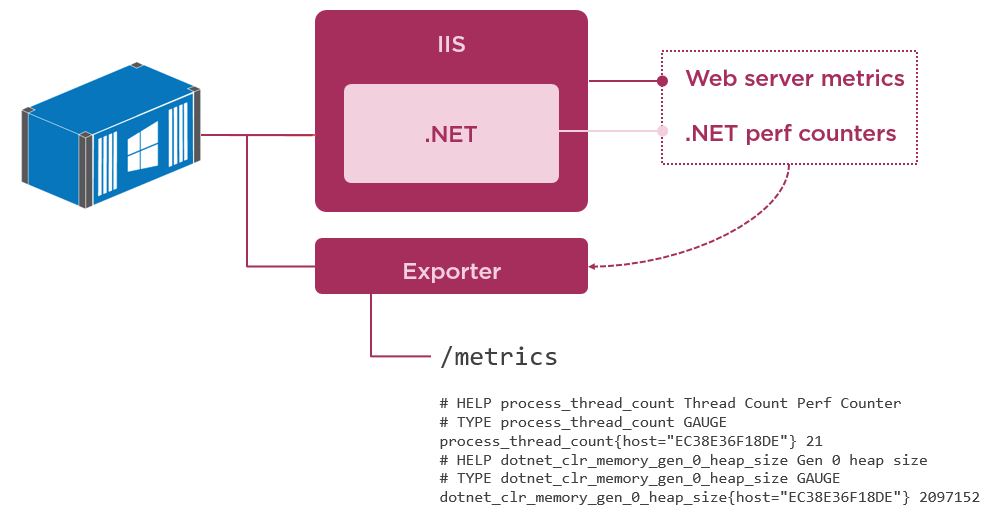
This is a simple and low-risk way to add monitoring to existing apps when you run them in Docker, without having to change the app at all (you just need to package a 3rd-party exporter in your Dockerfile).
The examples I use are:
Tomcat running a JSP website in a Linux container, with an exporter that gives you detailed metrics from the JVM and from the Tomcat web server.
IIS running an ASP.NET website in a Windows container, with an exporter that gives you metrics from Windows Performance Counters, including .NET and IIS metrics.
This level of monitoring tells you how hard your containers are working, which can be a good place to see if there’s a bottleneck somewhere, or if one container is misbehaving.
Exposing Application Metrics to Prometheus
If you want to provide custom metrics from your containers, then you do need to write some code. But it’s simple to do and gives you key information on what your app is actually doing.
I use the official Prometheus client library for Java, and the community Prometheus client library for .NET to add custom metrics to my web apps. I record basic things like number of logged-in sessions, number of items added to baskets and number of orders placed.
The client libraries provide the REST API for Prometheus, and I walk through some options for hosting the endpoint - I prefer to have separate endpoints for application and runtime metrics, so you can poll them on different schedules.
Application metrics tell you what’s happening inside your containers, so you can use them to provide real-time KPIs for business users, or technical stats for IT users.
Exposing Docker Metrics to Prometheus
Docker also exports metrics in Prometheus format (it’s an experimental feature right now, but I show you how to enable it and what it means to be running “experimental”).
You get one set of stats from the Docker engine, which includes container and healthcheck information, as well as server details and usage. This is the same for all editions of Docker, so you can show Docker platform stats in your dashboard and developers see the same details in Docker Desktop as the ops team see in production on Docker Enterprise.
And there’s a second set of stats from manager nodes when you’re running in swarm mode, which tell you details about the nodes in the swarm, along with low-level information about the performance of the cluster (including etcd and Raft).
This is the final level of detail that you want to see in your application dashboard. It’s great to see some of these details in an overview, because it makes it very easy to correlate between different sets of data and start looking at the root cause of problems.
If the number of logged-in users from your application metrics suddenly drops, and the number of HTTP requests served in your runtime metrics also drops, you can check your Docker metrics - maybe your healthchecks are all failing, which points to a bad release; or maybe half of your nodes have gone offline. Seeing all this data in one place gives you a whole lot of insight.
Building Dashboards with Grafana
The last thing I show you is how to build your dashboard in Grafana, using PromQL queries to pull all the key application, runtime and Docker metrics into one dashboard:
Grafana itself is pretty simple to use, and I cover data sources, dashboards and panels. I also show you how to package Grafana with your own configuration, so you build a custom Docker image that has:
- your Prometheus data source configured
- your application dashboard deployed
- a read-only user created
- your dashboard set as the homepage for the read-only user
I cover the same for Prometheus too, so you end up with Dockerfiles for Prometheus and Grafana that let you automate deployment in the exact same way that you do with your application images and containers.
Learn All the Dockers with Pluralsight!
This course is part of the Docker learning path, which has excellent content from Docker Captain Nigel Poulton (among others):
One course .NET folks will find useful isn’t on that path, my Modernizing .NET Framework Apps with Docker. But that one is in Scott Hanselman’s great things-to-learn channel:
That lot should get you pretty far in your Docker journey :)
Comments