
Querying Elasticsearch with PowerBI
Microsoft’s PowerBI is a great end-user tool for self-service BI. It has a host of connectors so you can easily pull data from SQL Server, GitHub, Google Analytics and Azure - and there are generic connectors for other data sources.
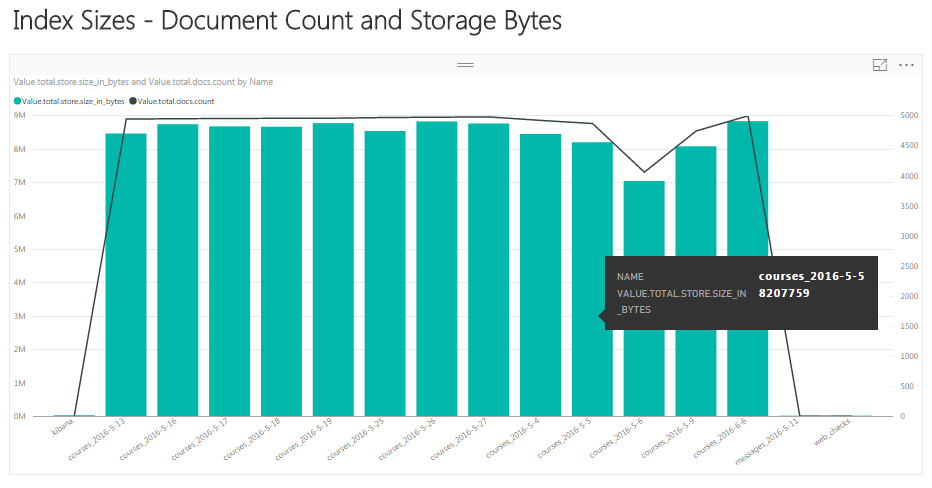
There isn’t a specific connector for Elasticsearch, but you can use the generic Web source with the Elasticsearch REST API. In this post I’ll walk through building a simple visual that uses the Elasticsearch Indices API to show a breakdown of all the indexes in your Elasticsearch cluster:
Making the Connection
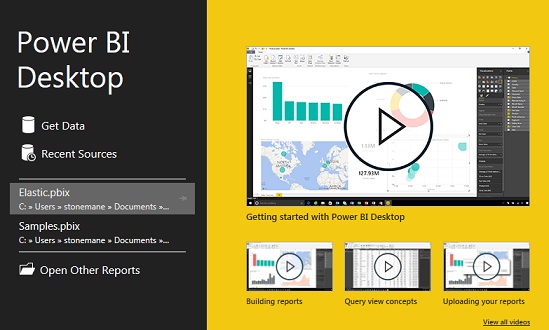
PowerBI Desktop is a free Windows app which you can use to build complex visuals from various data sources. When you first run it you’ll see a splash screen which invites you to Get Data to create a new report:
Click that link and you can make your connection to Elasticsearch. You’ll need to select the Other category and choose Web. Click Connect and enter the URL for Elasticsearch - this is the source data for the report, which will be one of the REST API endpoints.
I’m using the stats endpoint to get index details, so the query in this post will work with any cluster, but you can use the Search APIs to query your document indexes.
Assuming you’re running Elasticsearch locally, the base URL for the Indices Stats API is http://localhost:9200/_stats
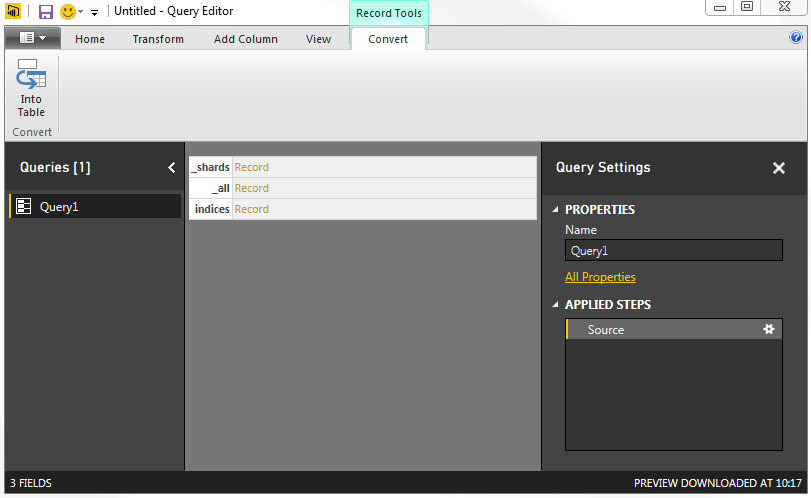
PowerBI connects to the URL and it can navigate the JSON response from the API. The Query Editor window loads and you can drill down to select all the data you want available in the report.
Building the Query
The PowerBI Query Editor lets you graphically construct filters and transforms, so you can manipulate the source data into something more useful for end-users to query. The raw JSON from Elasticsearch for one index in the stats API response looks like this (abbreviated):
{
    "_shards": { ... },
    "_all": { ... },
    "indices": {
        "courses_2016-5-9": {
            "primaries": {
                "docs": {
                    "count": 4747,
                    "deleted": 0
                },
                "store": {
                    "size_in_bytes": 8085421,
                    "throttle_time_in_millis": 0
                },
                "indexing": {
                    "index_total": 0,
                    "index_time_in_millis": 0,
                    "index_current": 0 ...
For my simple report, I want the document count and total size of each index. From the Query Editor, I can expand the indices field by clicking the Record link:
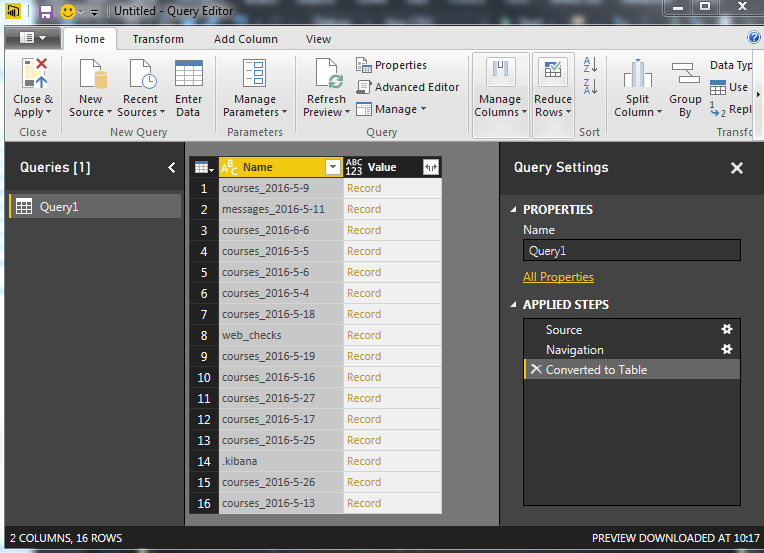
And then click the Convert Into Table button to convert the entries in the indices collections into rows which PowerBI can present:
When you have a nested object in the source, like here where each index has child JSON objects called primaries and total, you can expand the record to flatten the fields and make them available to the report. The expand button in right of the column header lets you choose which fields to pull from the source:
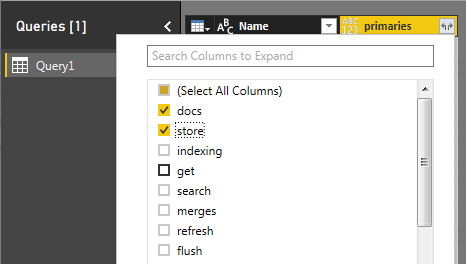
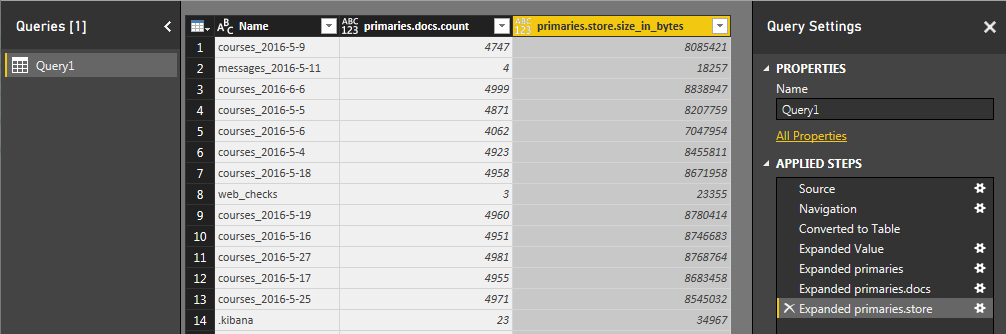
Like any complex API, the stats response has many nested values and you’ll need to keep expanding the record and selecting the fields you want until you get a query like this - which just has the index name, document count and store size:
You can right-click the column headings to do interesting stuff like change the data type, and do basic transformations - uppercase strings, round numbers and so on. You can’t write custom code here, though.
Behind the scenes, the PowerBI Query Editor will build up a query in Power Query Formula Language (PQFL). Yes, that’s another language to learn - but it can also be used with Power Query in Excel.
Once you have the basic query structure, it can be easier to switch to the Advanced Editor view and edit the query manually
This is how my final query looks in PQFL, transforming the raw JSON from Elasticsearch, extracting the fields I want, and exposing them as numerics so I can work with them in PowerBI:
let
    Source = Json.Document(Web.Contents("http://localhost:9200/_stats")),
    indices = Source[indices],
    #"Converted to Table" = Record.ToTable(indices),
    #"Expanded Value" = Table.ExpandRecordColumn(#"Converted to Table", "Value", {"primaries"}, {"primaries"}),
    #"Expanded primaries" = Table.ExpandRecordColumn(#"Expanded Value", "primaries", {"docs", "store"}, {"primaries.docs", "primaries.store"}),
    #"Expanded primaries.docs" = Table.ExpandRecordColumn(#"Expanded primaries", "primaries.docs", {"count"}, {"primaries.docs.count"}),
    #"Expanded primaries.store" = Table.ExpandRecordColumn(#"Expanded primaries.docs", "primaries.store", {"size_in_bytes"}, {"primaries.store.size_in_bytes"}),
    #"Changed Type" = Table.TransformColumnTypes(#"Expanded primaries.store",{{"primaries.docs.count", Int64.Type}, {"primaries.store.size_in_bytes", Int64.Type}})
in
    #"Changed Type"
Constructing Visualisations
It’s simple now to build a nice visualisation. As an example, to see the size of the indexes, select Line and Stacked Column Chart from the Visualisation Pane, and drag in all the values from ‘Query1’ in the Fields Pane:
Name-> Shared Axisprimaries.docs.count-> Column valuesprimaries.store.size_in_bytes-> Line values
Your report design should look like this:
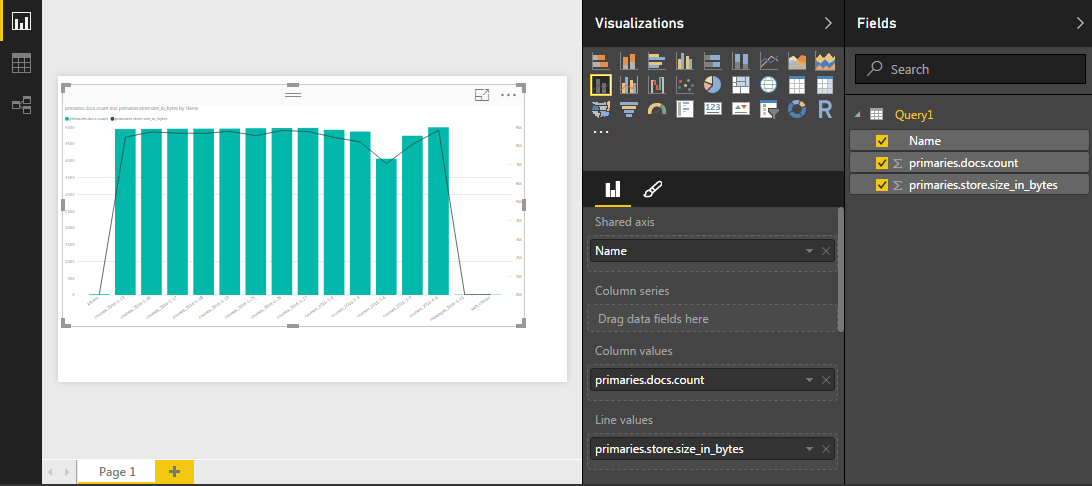
And now all you have to do is add a nice legend and tidy it up a bit.
Why PowerBI?
Kibana is the natural UI choice for partnering Elasticsearch, and it has the advantage of being Web-based and Dockerized, so it’s cross-platform and easy to share. But PowerBI is a lot more powerful, and the multitude of available connectors mean it’s easy to build a single dashboard which pulls data from multiple sources.
Using Elasticsearch for one of those sources is simple, although it will need some custom work to query your indexes and navigate the documents to get the field you want. You can even publish your reports to PowerBI in the cloud and limit access using Azure Active Directory - which gives you a nice, integrated security story.
Comments